

Deploying applications on Unkey is in public beta. To try it, open the product switcher in the
top-left of the dashboard and select Deploy. During beta, deployed
resources are free. We’re eager for feedback, so let us know what you think
on Discord, X, or
email support@unkey.com.
Request fields
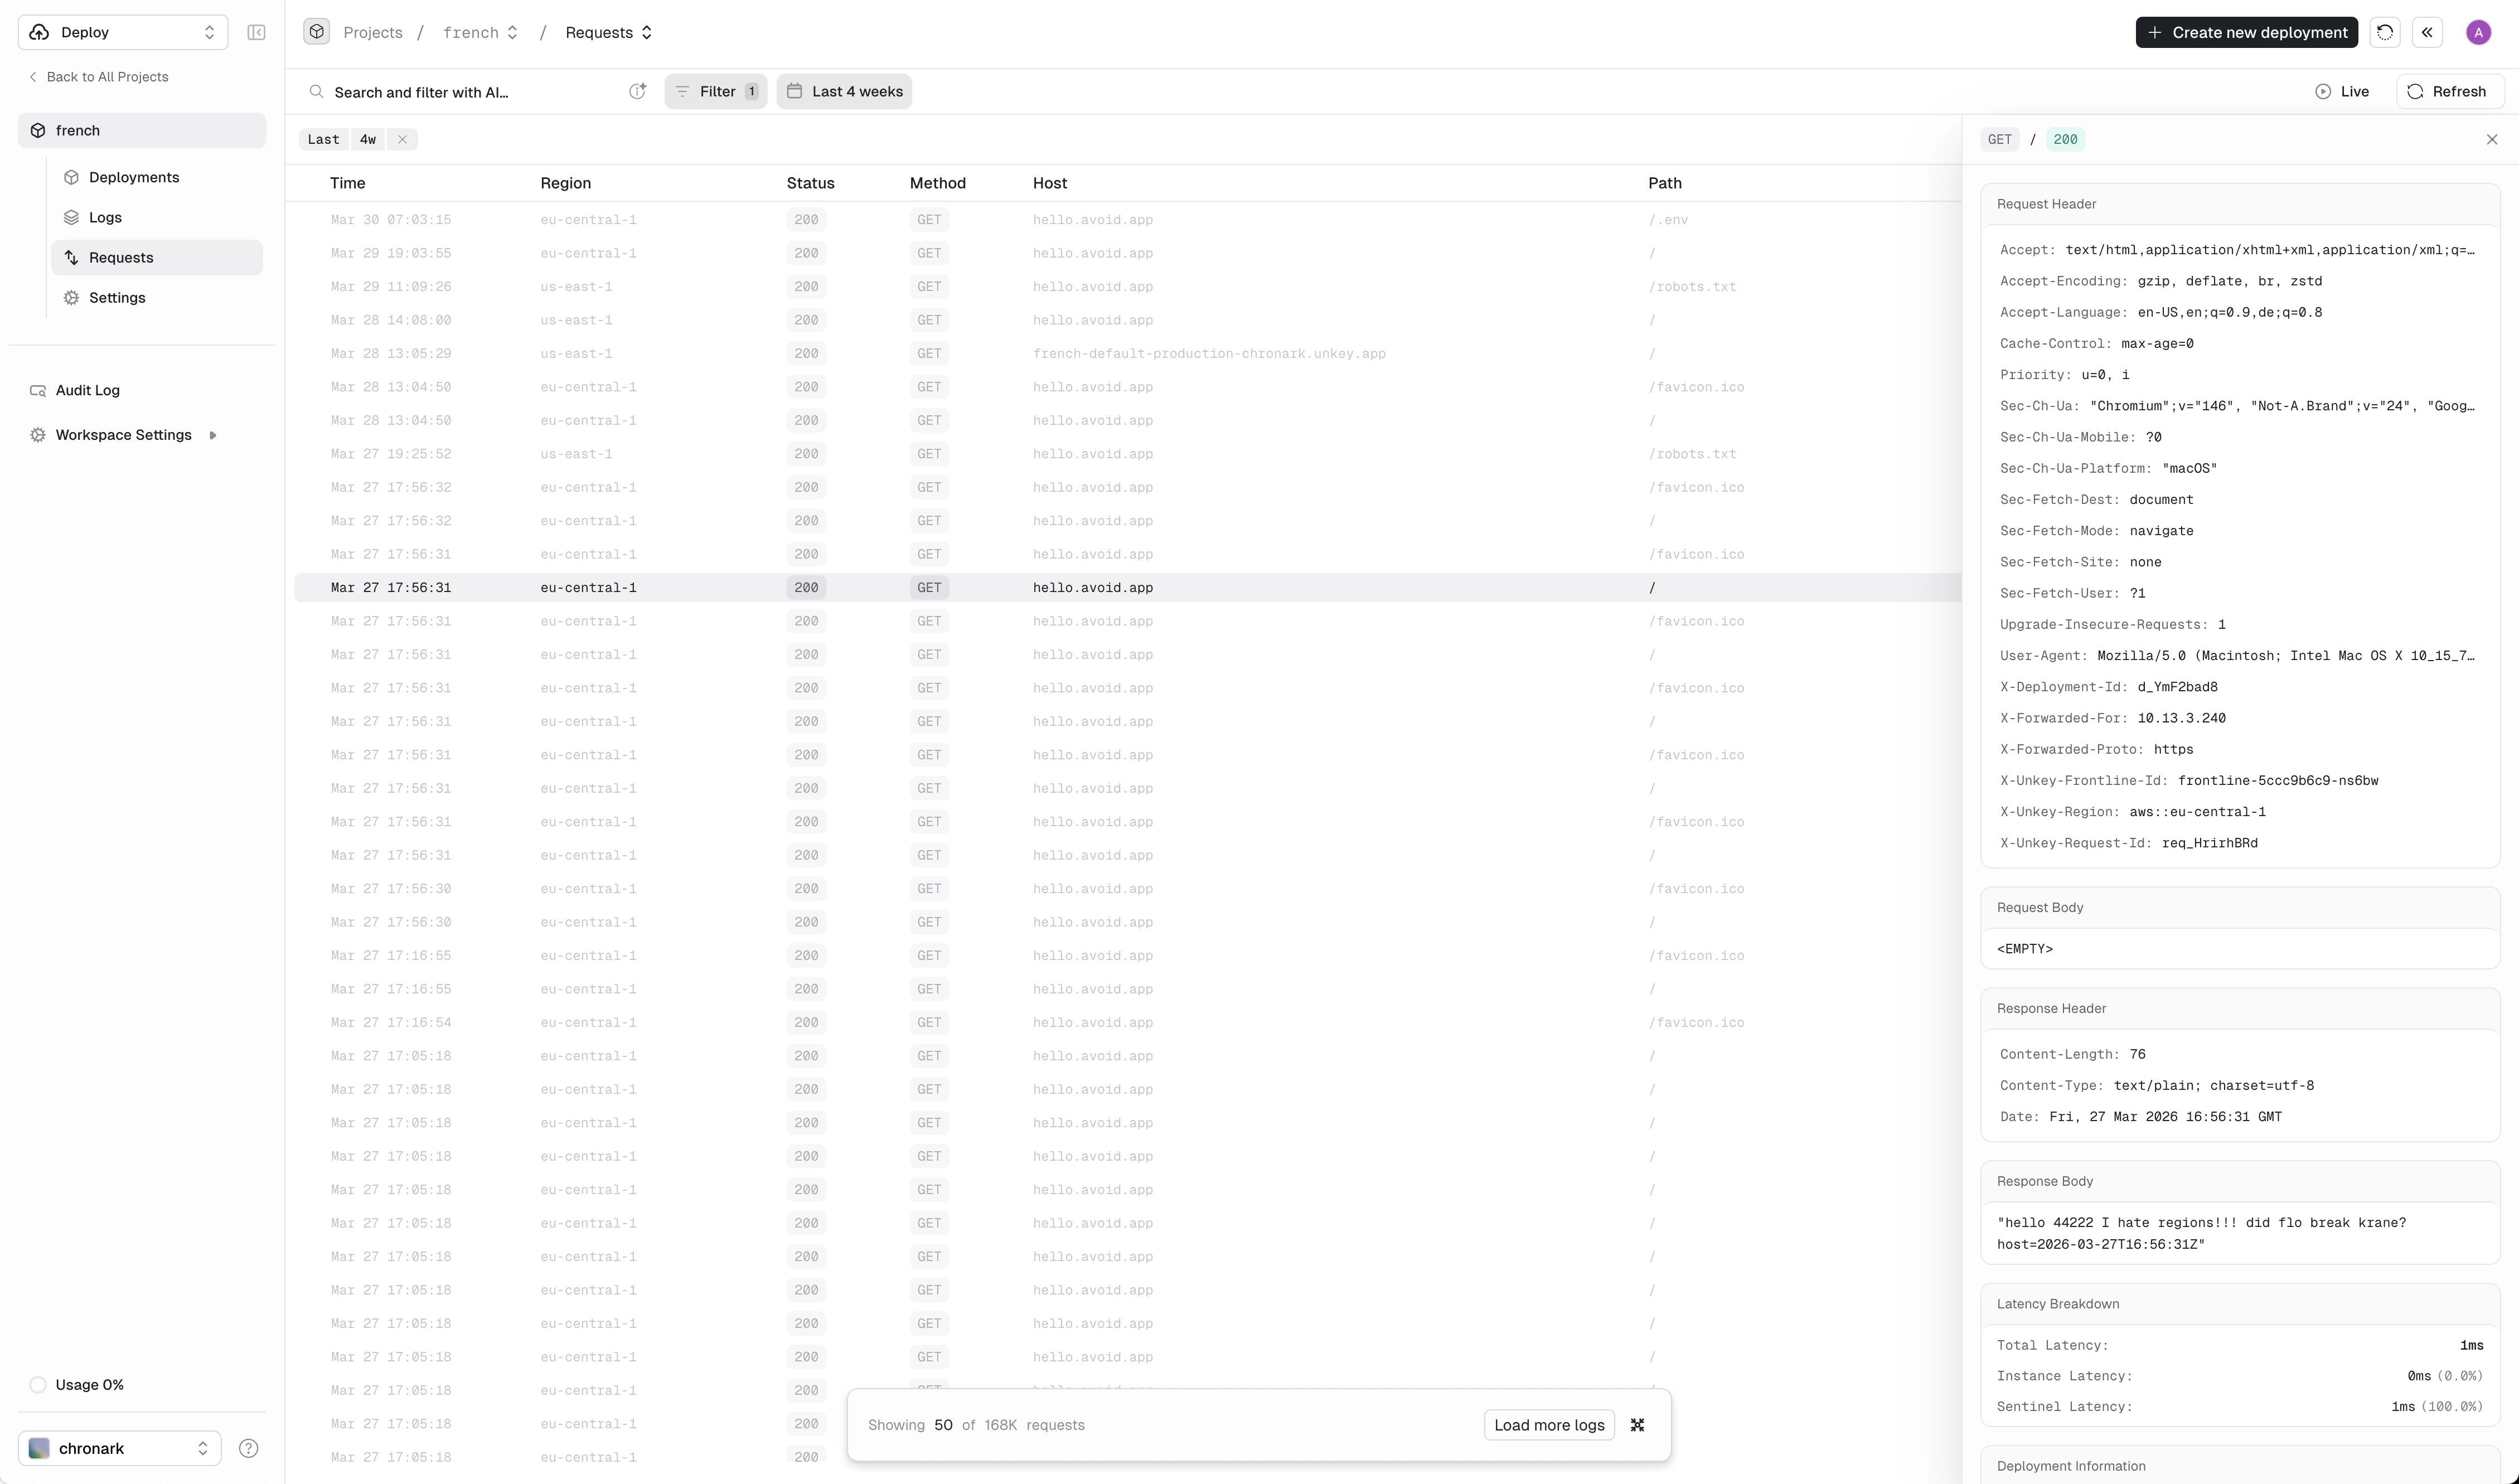
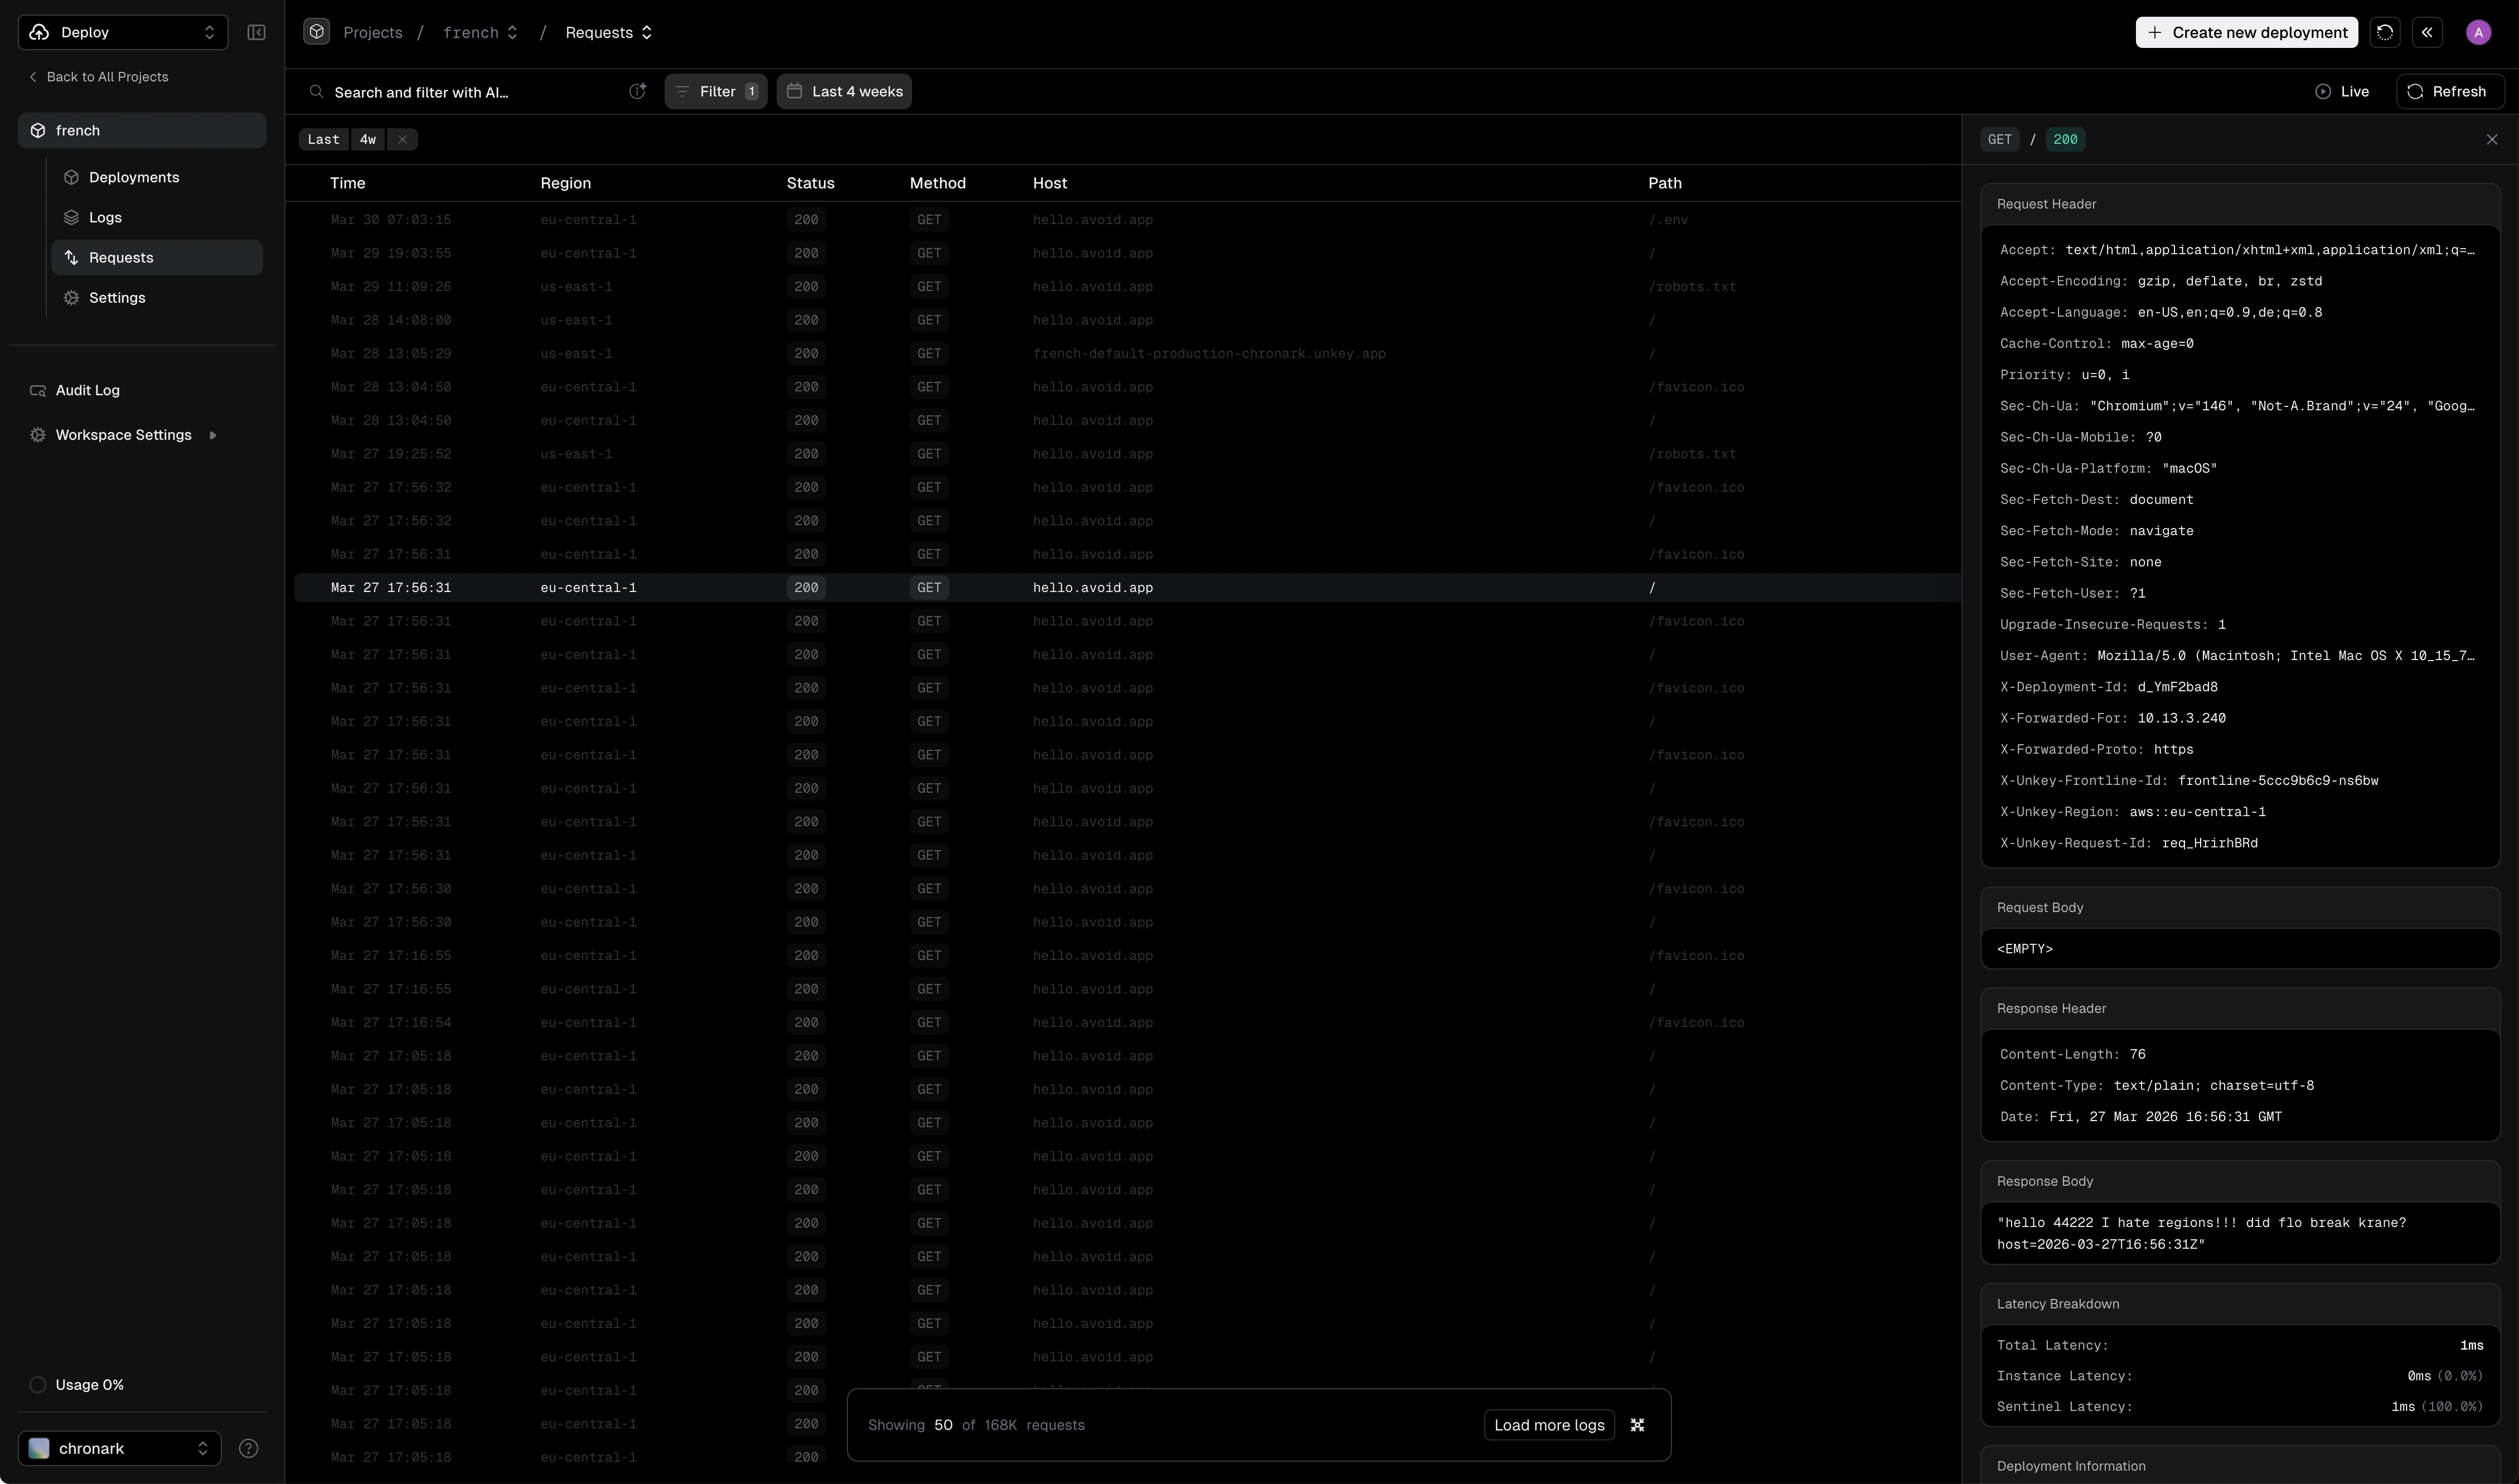
Each row in the table shows the timestamp, the region that handled the request, the HTTP status code (color-coded by class), the HTTP method, the hostname, the request path, and the total end-to-end latency.Filter requests
Combine filters to narrow results by status code, HTTP method, path, deployment, environment, and time range. Filters persist in the URL, so you can bookmark or share a filtered view.Status code filter
The status code filter lets you narrow requests by HTTP response status. You can filter by class or by a specific code. Filter by class, select one or more status code ranges to show all requests in that class:| Range | Label |
|---|---|
| 2xx | Success |
| 3xx | Redirect |
| 4xx | Warning |
| 5xx | Error |
429 for rate-limited requests or 503 for service unavailable responses. When you type a custom code, range selections are cleared automatically.
Click Apply Filter to update the results.
Live mode
Toggle Live in the top-right corner to stream incoming requests in real time. New requests appear at the top of the table as they arrive. Toggle it off to freeze the view and browse historical data.Request detail panel
Click any row to open the detail panel on the right side. The panel shows:- Request headers and body
- Response headers and body
- Latency breakdown (see below)
- Deployment info: deployment ID, git branch, commit SHA, commit author, commit message, environment, and deployment status
- Meta: request ID, timestamp, client IP, user agent, host, region, query string, and query parameters