

Write logs you can filter
Print one JSON object per line, withlevel and message (or msg), and put the values you’ll search for in their own fields:
error, message charge failed, and attributes order_id, customer.id, customer.plan, and attempt, which you can all filter on.
How lines are read
Color codes are removed first.- JSON object: the message is
msgormessage(or the whole line), the severity islevelorseverity(defaultinfo), and every other key becomes an attribute, including nested ones. key=value(logfmt): handled like JSON, but only if the line haslevel,severity,msg, ormessage.- Anything else: plain text. The whole line is the message, and we guess the severity. Panics, tracebacks, exception names, and words like
error,fatal,failed to,crashed, oroommean error.warnorwarningmean warning, anddebugortracemean debug. Everything else is info. If severity matters, use JSON.
Filter the logs
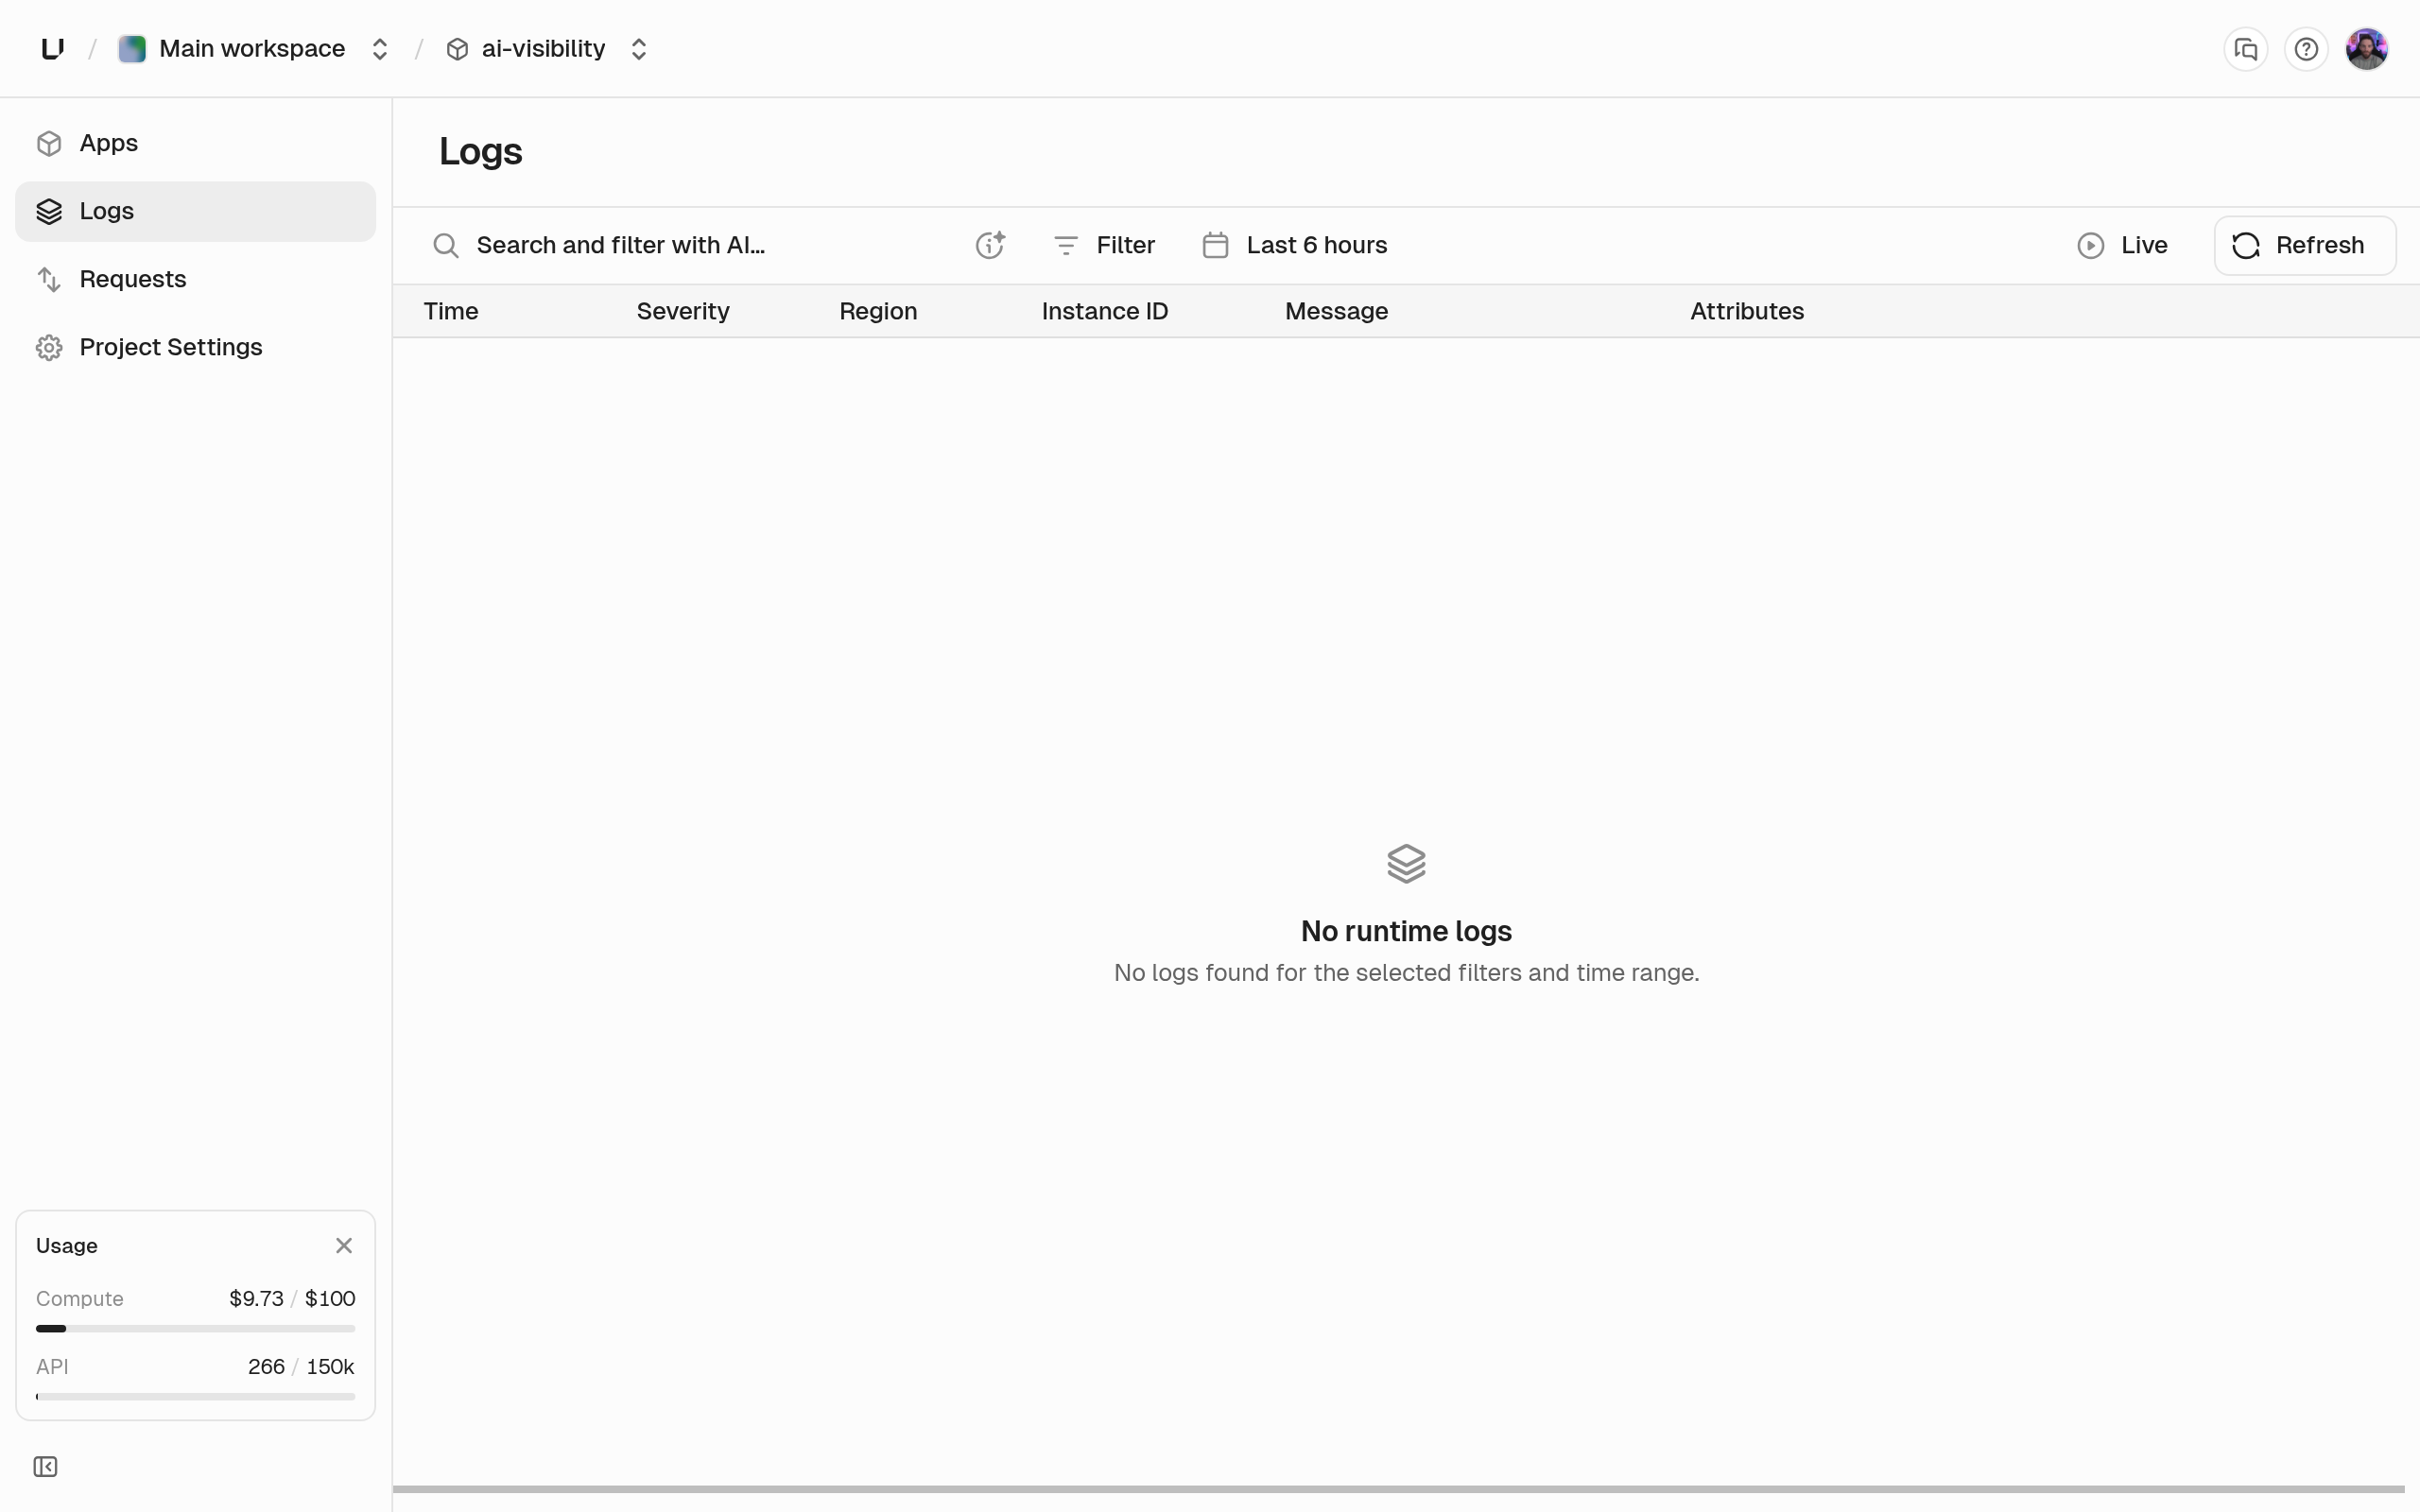
Each entry shows its severity, time, message, attributes, and the instance and region that wrote it.
Retention and access
Runtime logs are kept for 90 days, and the dashboard shows all of them. The analytics API can only reach back as far as your plan’s log query range: 3 days on Starter, 7 on Pro, and 14 on Business. A query that reaches further fails witherr:user:bad_request:query_range_exceeds_retention. See Compute limits.
To query logs with SQL, use the runtime_logs_v1 table. See Query gateway requests and runtime logs.