See the spend, query the traffic, run the gateway locally
September shipped the bill by project, SQL over your logs, image deploys, and tighter keys.


You can see where Compute spend went. You can query the traffic that caused it. And you can run the same gateway on your machine before you ship.
That's September.
Compute spend by project
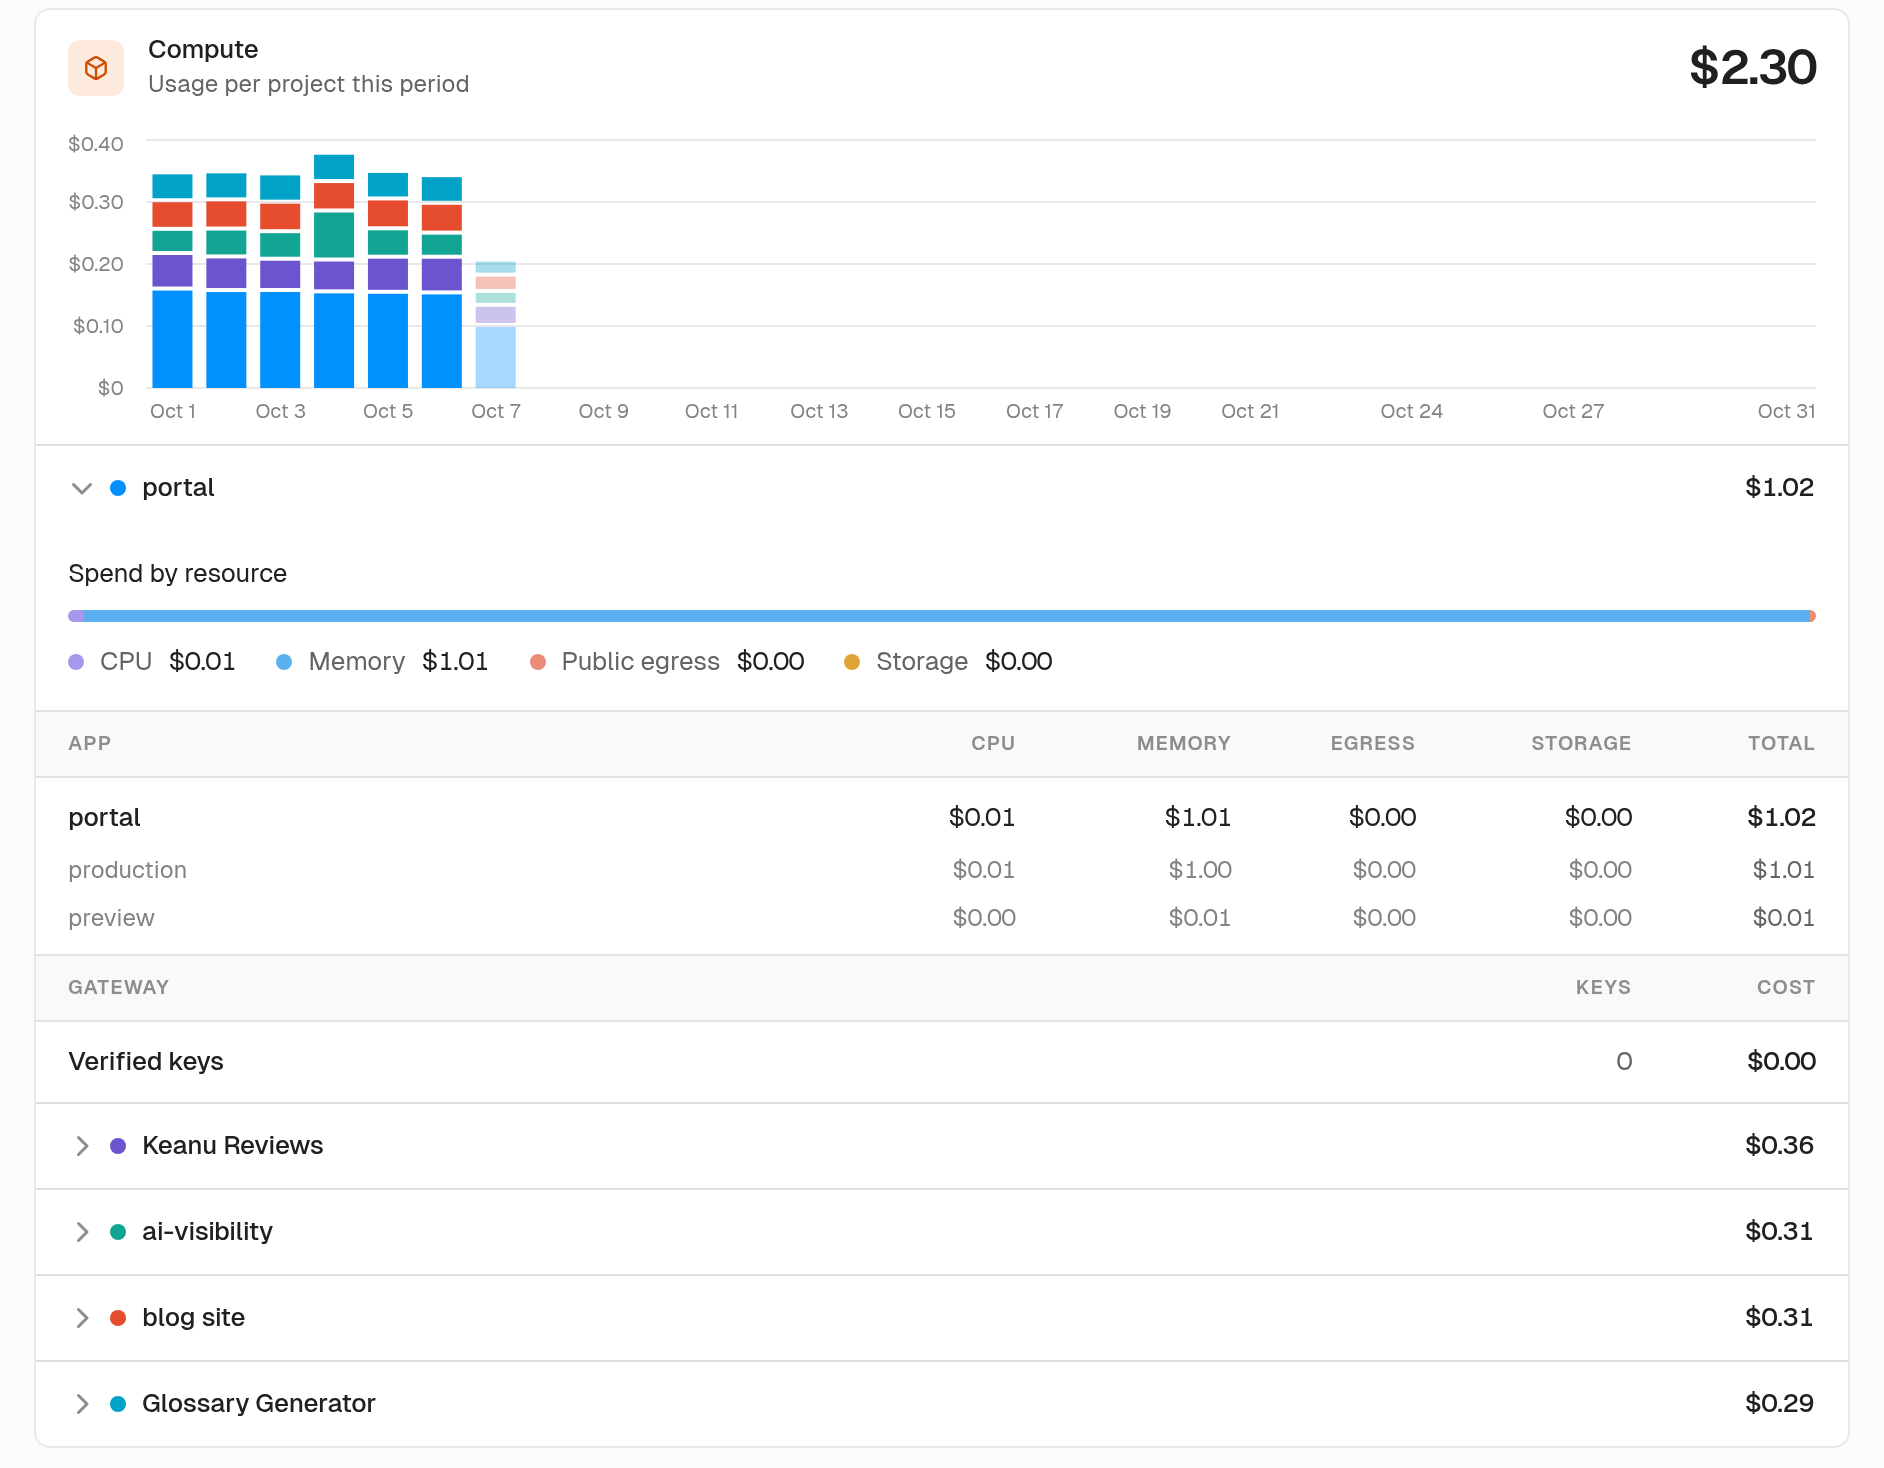
The usage page shows where your Compute spend went during the month. A stacked daily chart splits cost by project. Hover a day and you'll see that day's projects ranked. Today's bar stays pale until the day is over.
Open a project and you get spend by resource and a table for each app. Every cell is a cost. Hover it and you see the quantity behind it.
Gateway request and runtime log analytics
The gateway now writes a base request log on every request. Five extra capture settings stay opt-in, so you can turn the detail up when you need it.
analytics.getGatewayRequests runs SQL over the requests Unkey routed to your deployments. Break down paths, status codes, and latency from a trusted backend with a root key. analytics.getRuntimeLogs does the same for a deployment's stdout and stderr. Rate-limit data is queryable the same way: limits, rejections, and usage.
See gateway request analytics, runtime log analytics, and rate-limit analytics.
Log drains
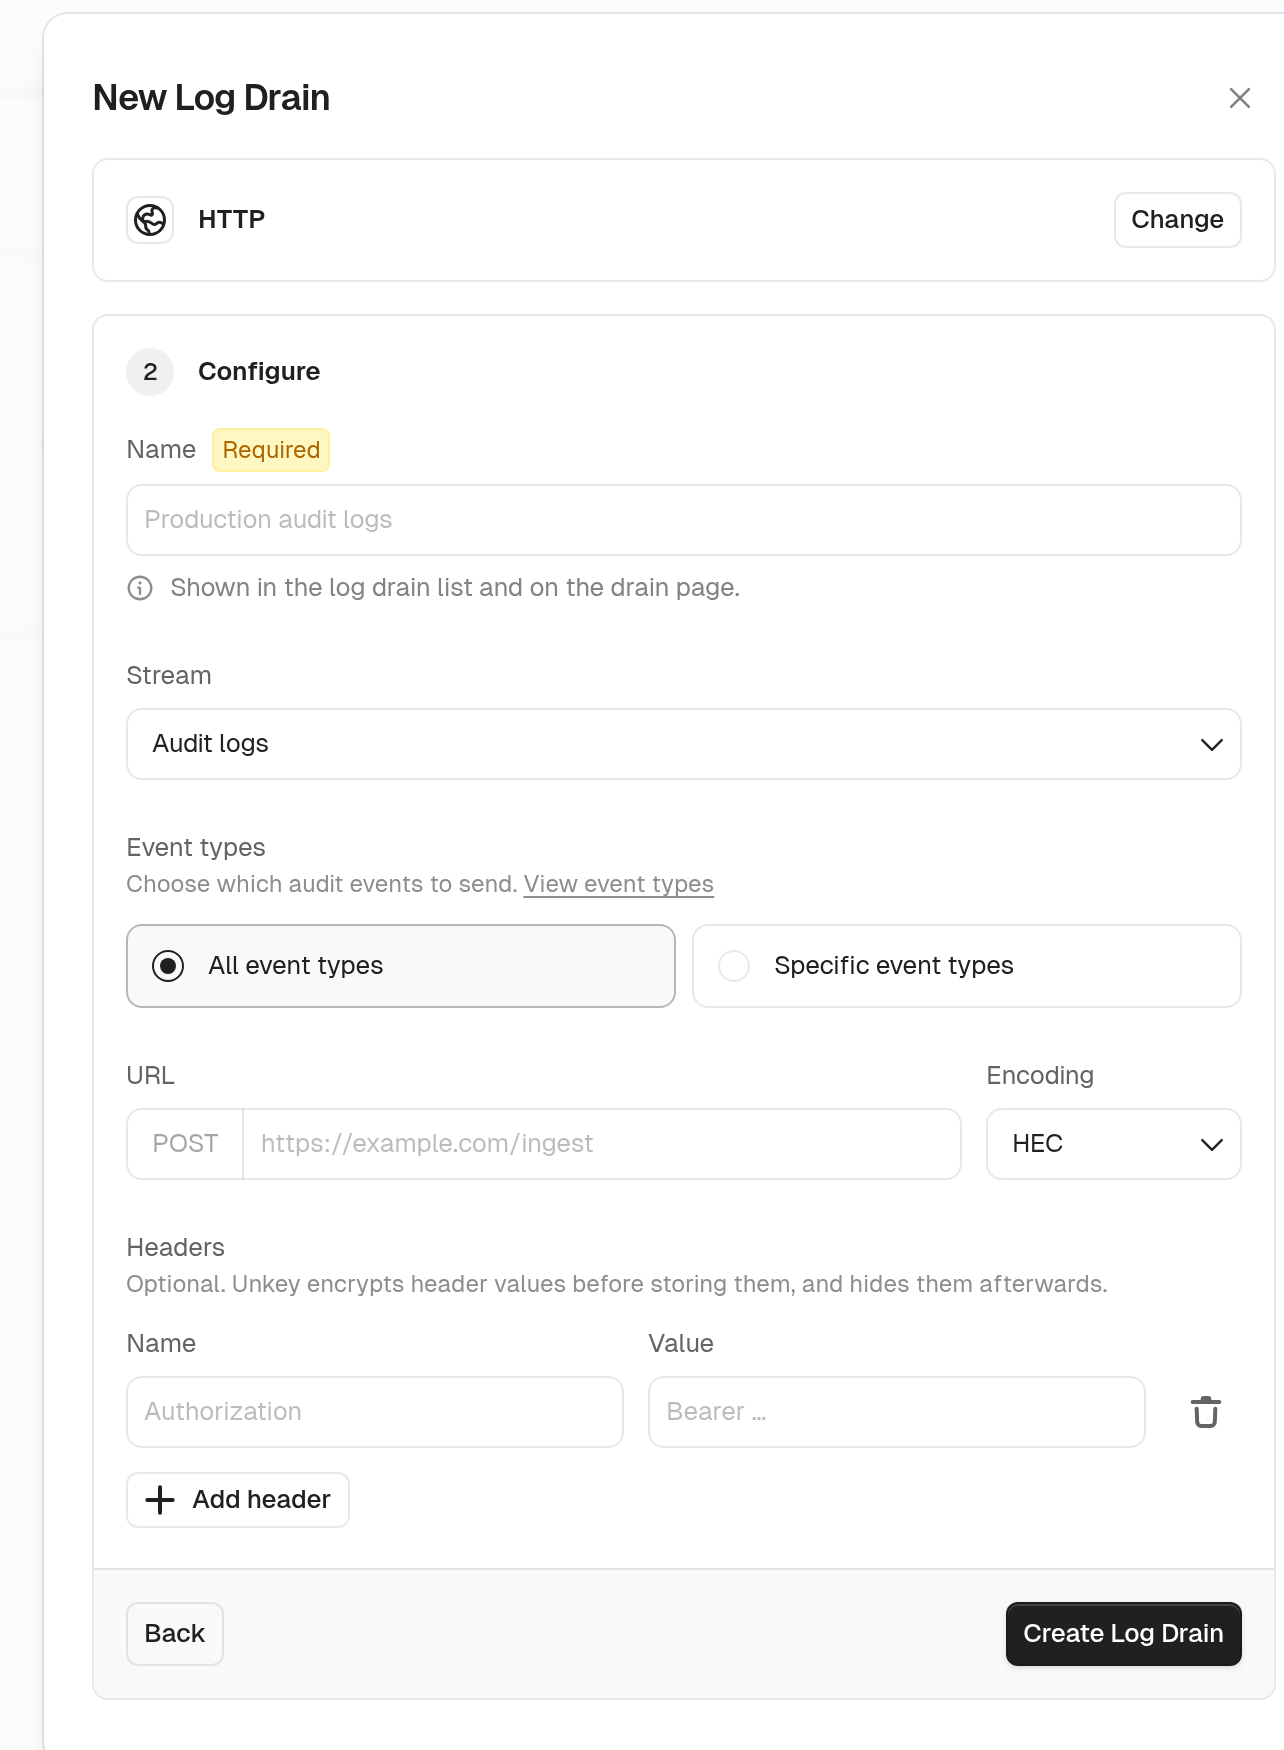
You shouldn't have to live in the dashboard to know what happened. You can send one stream of workspace events to an HTTPS endpoint or an Axiom dataset. Pick from audit logs, key verifications, gateway requests, runtime logs, or rate limits. You can filter a drain by event type, keyspace, source, status class, severity, namespace, or pass and block results.
HTTP drains send JSON, NDJSON, or Splunk HEC, and that includes CrowdStrike NG-SIEM. The settings page shows how many drains you're using against your workspace limit. Every workspace starts at zero, so contact support and we'll raise it.
Audit logs also record more key and rate-limit actions, so the trail is clearer when a key is created, updated, or verified, and when a rate limit is applied or overridden.
See log drains and audit log event types.
Deploy from a container image and run the gateway locally
The new-app flow accepts a container image as a source, not only a GitHub repo. Build the image yourself and point Unkey at it.
Same gateway, now on localhost. Routes and policies come from a config file. Keys are verified against Unkey, and rate limits run in memory for that local process. Put it in front of a service on localhost and you get the same checks you run in production.
See deploying a pre-built image and local development with the gateway.
Production environments, custom domains, and deploy checks
You can mark an environment as production. Production is no longer implied by the name.
Custom domains moved into the API too. You can create, get, list, delete, and verify them, and attach a domain and check DNS the same way you already do from the dashboard. The dashboard can list those domains for a workspace, a project, or an app.
The deploy flow does more of the checking up front. The dashboard suggests root directories and watch paths, and those paths are checked before a deploy starts. If a deploy fails because you hit a quota, it sends you to the Limits page. A successful deploy gets a short celebration, and the source is click to copy.
Deployments and active branches
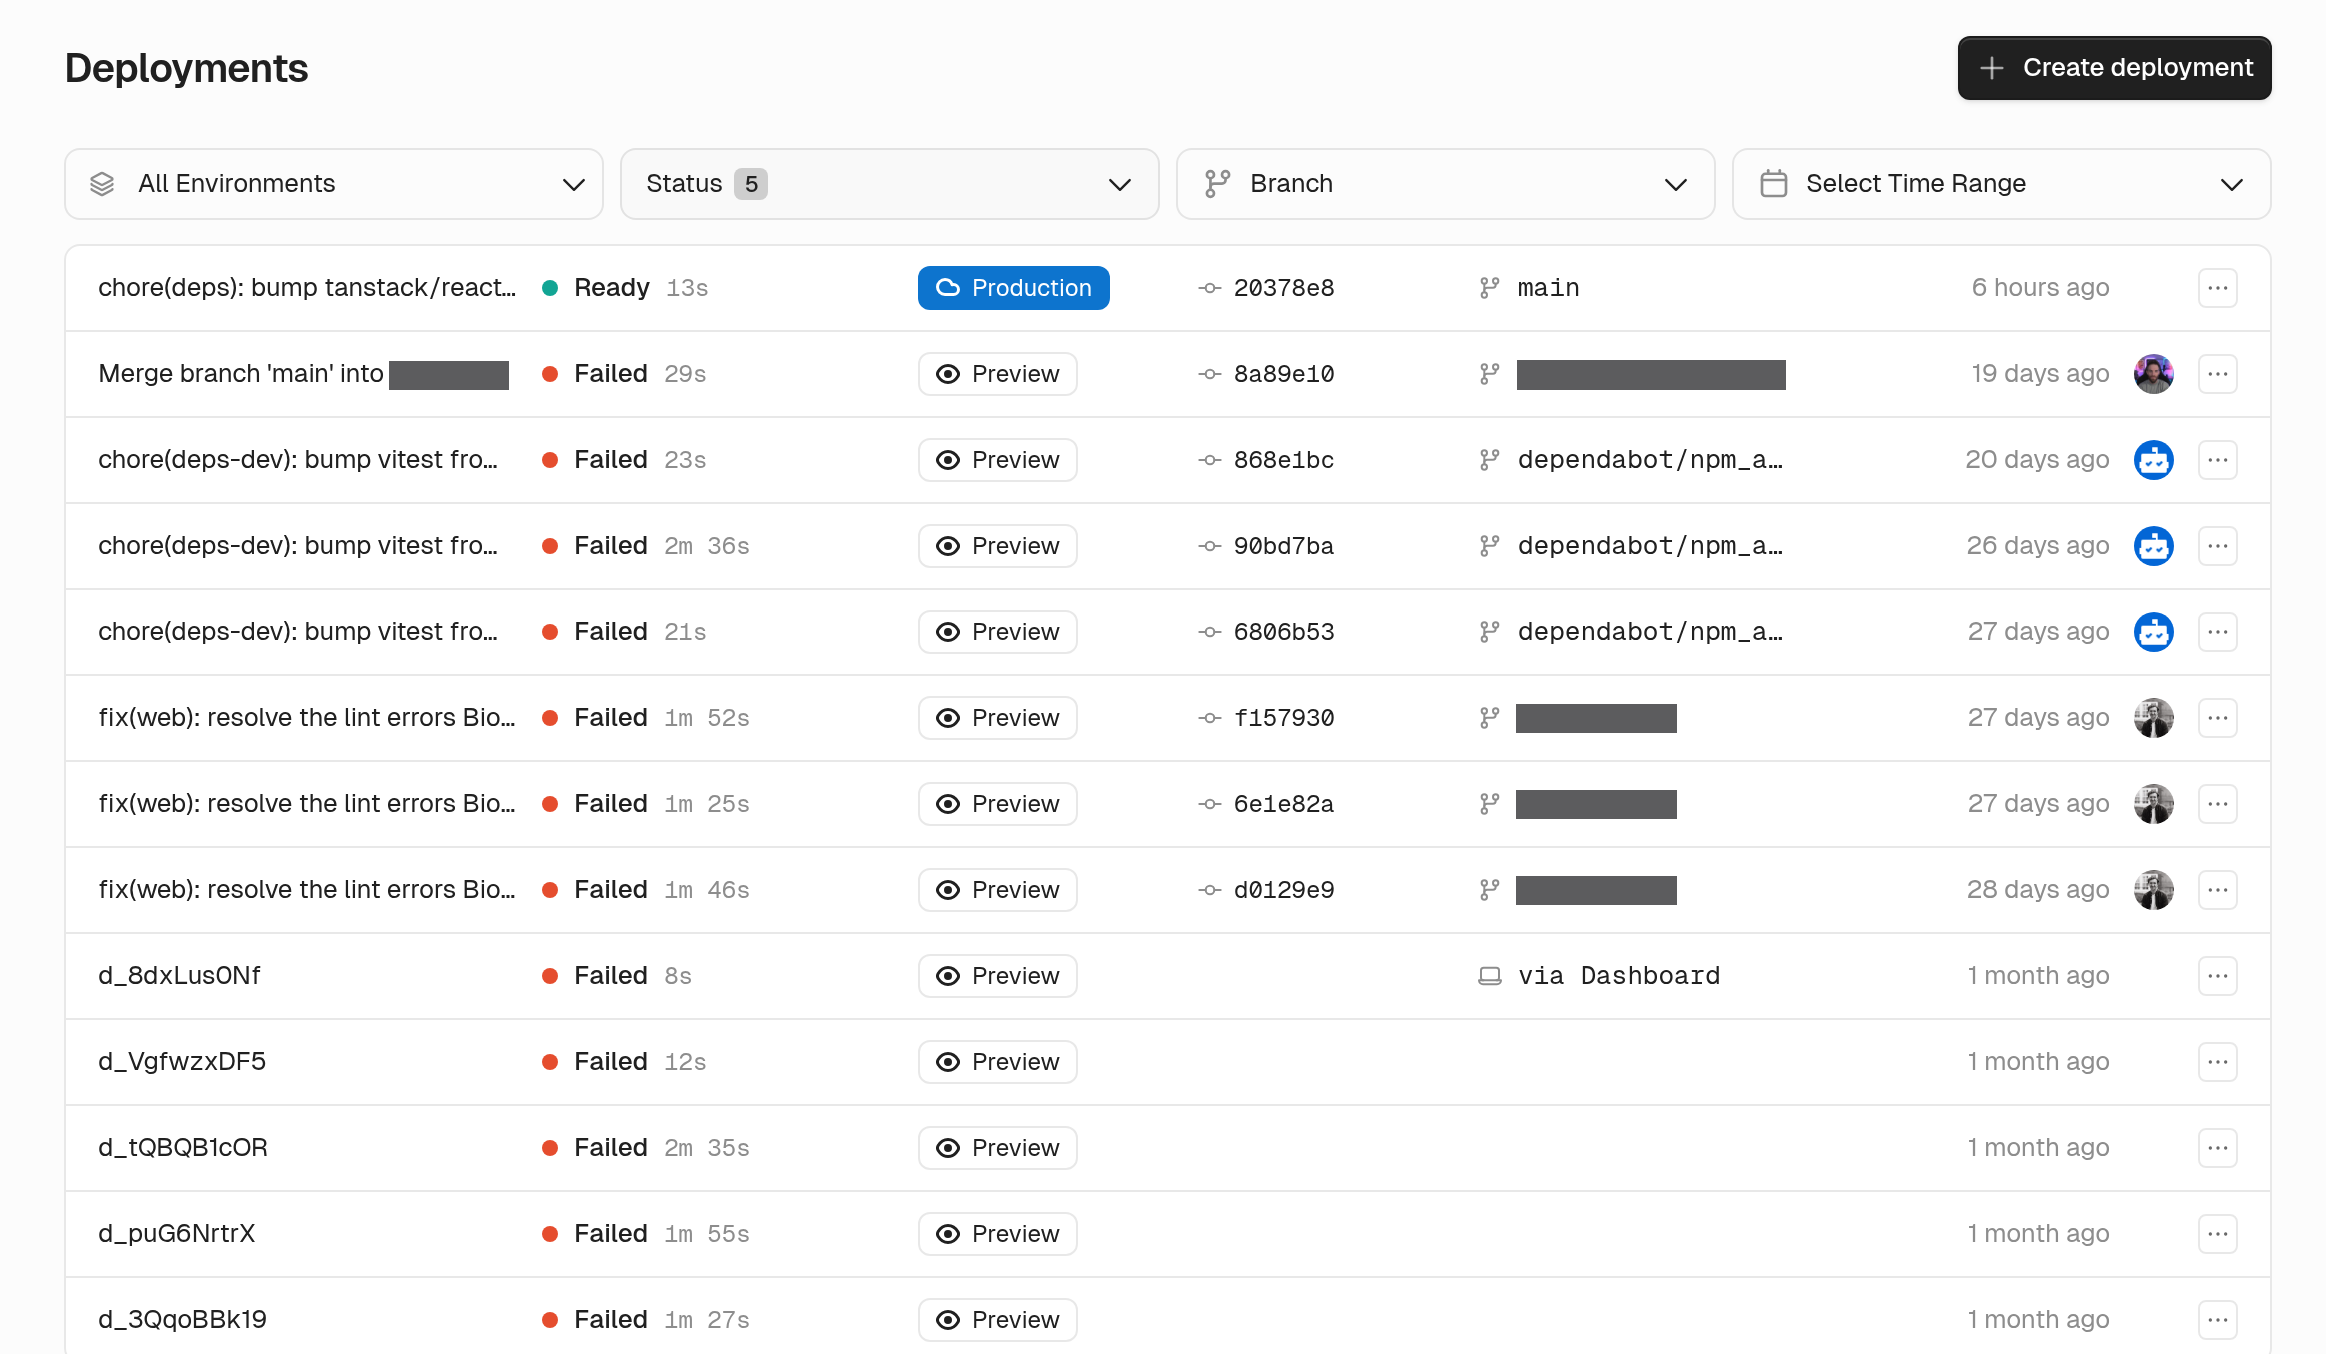
Each deployment is one row now. The live production release gets a filled Production pill, and older production releases and previews get an outline. Deploys from the CLI, the API, or the dashboard show where they came from. Skipped deployments stay out of the default view, so a monorepo is readable, and you can still filter to just those. Filters and paging cover the full deployment history.
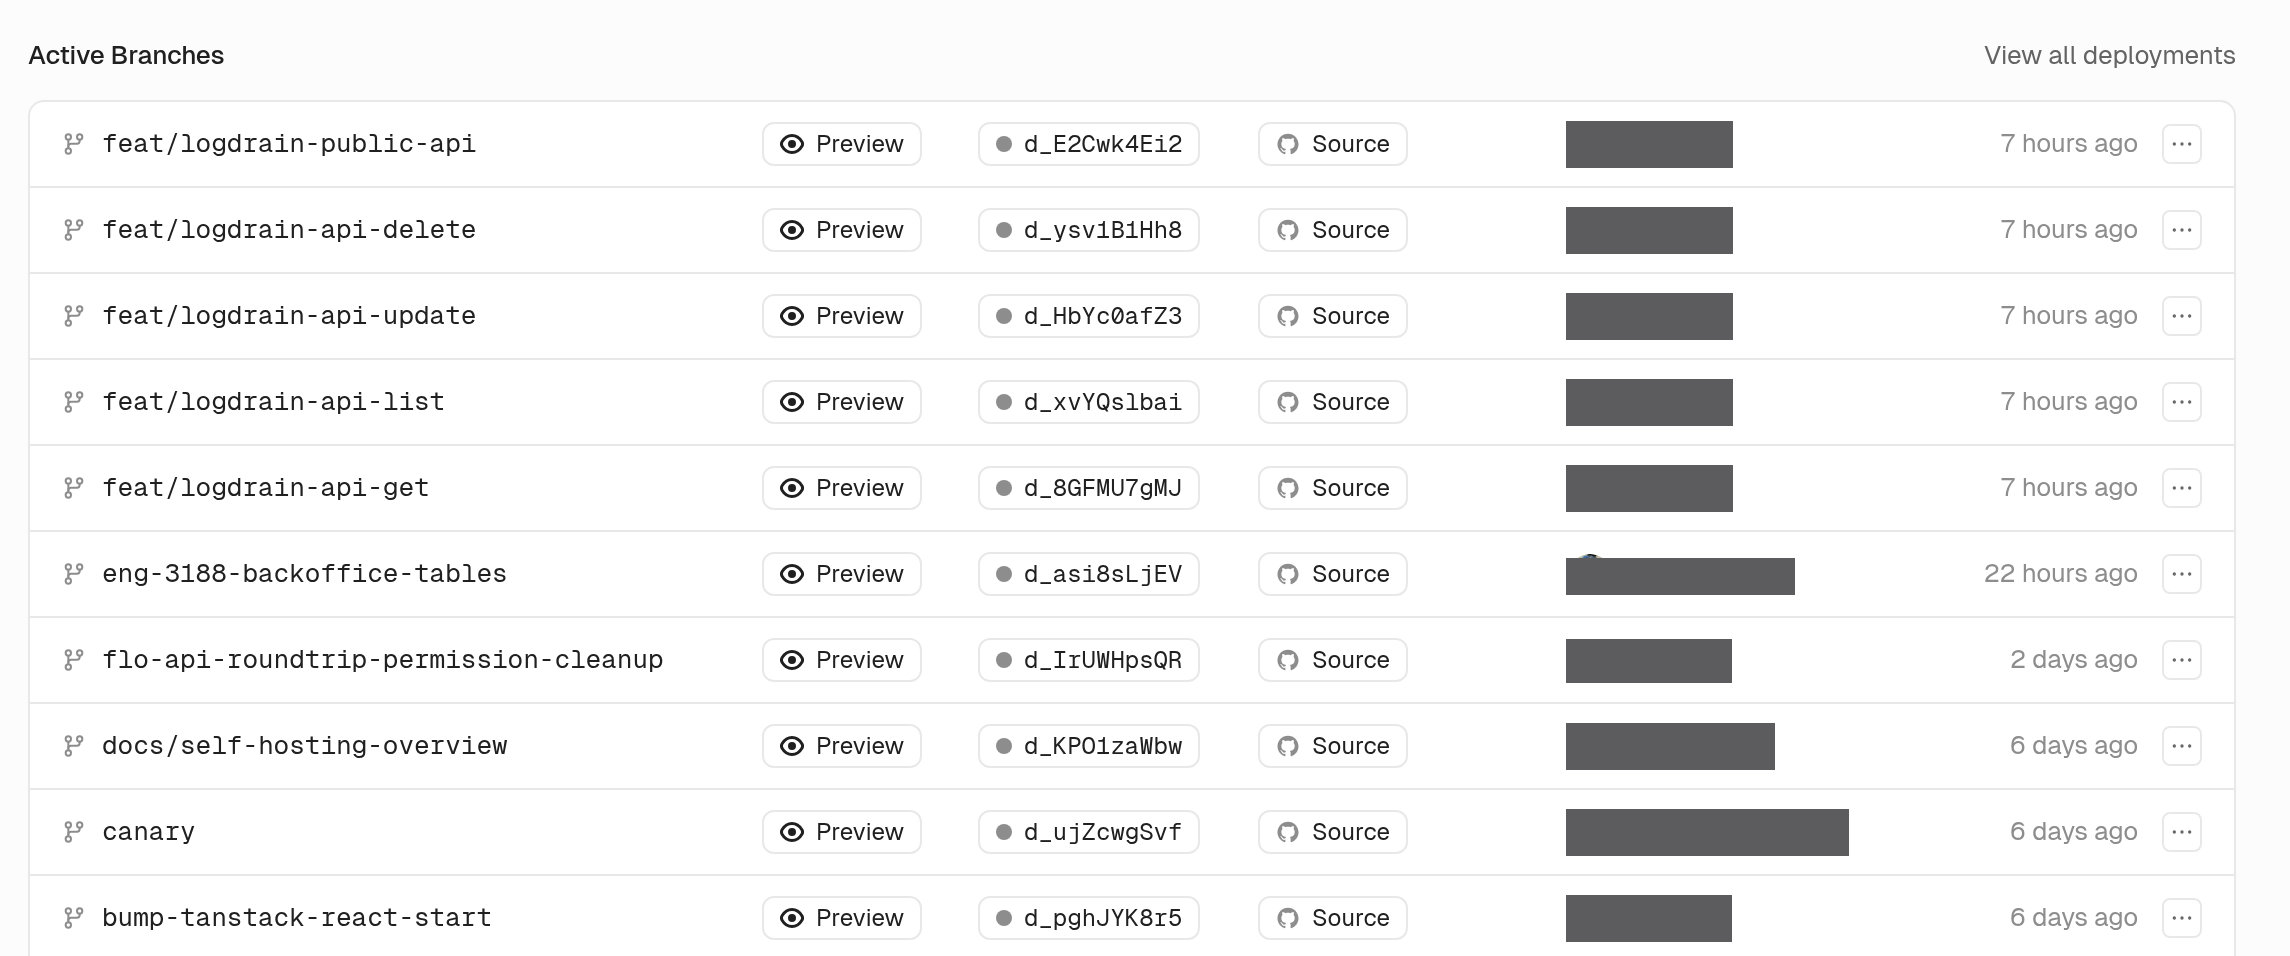
On a Git-connected app, the overview lists your active preview branches, newest first. From there you can stop, wake, redeploy, or cancel each one. Long branch lists load one page at a time.
For 30 minutes after a production deploy, the deployment page reminds you that you can roll back. The dialog names the deployment you're going back to.
You can also see deployment status without opening anything. Project cards show each app's current deployment, including builds that are still running or have failed. The production card on the app overview shows the same status, and container-image apps list recent deployments under that card. The apps page has a redesigned card, a list view, and search.
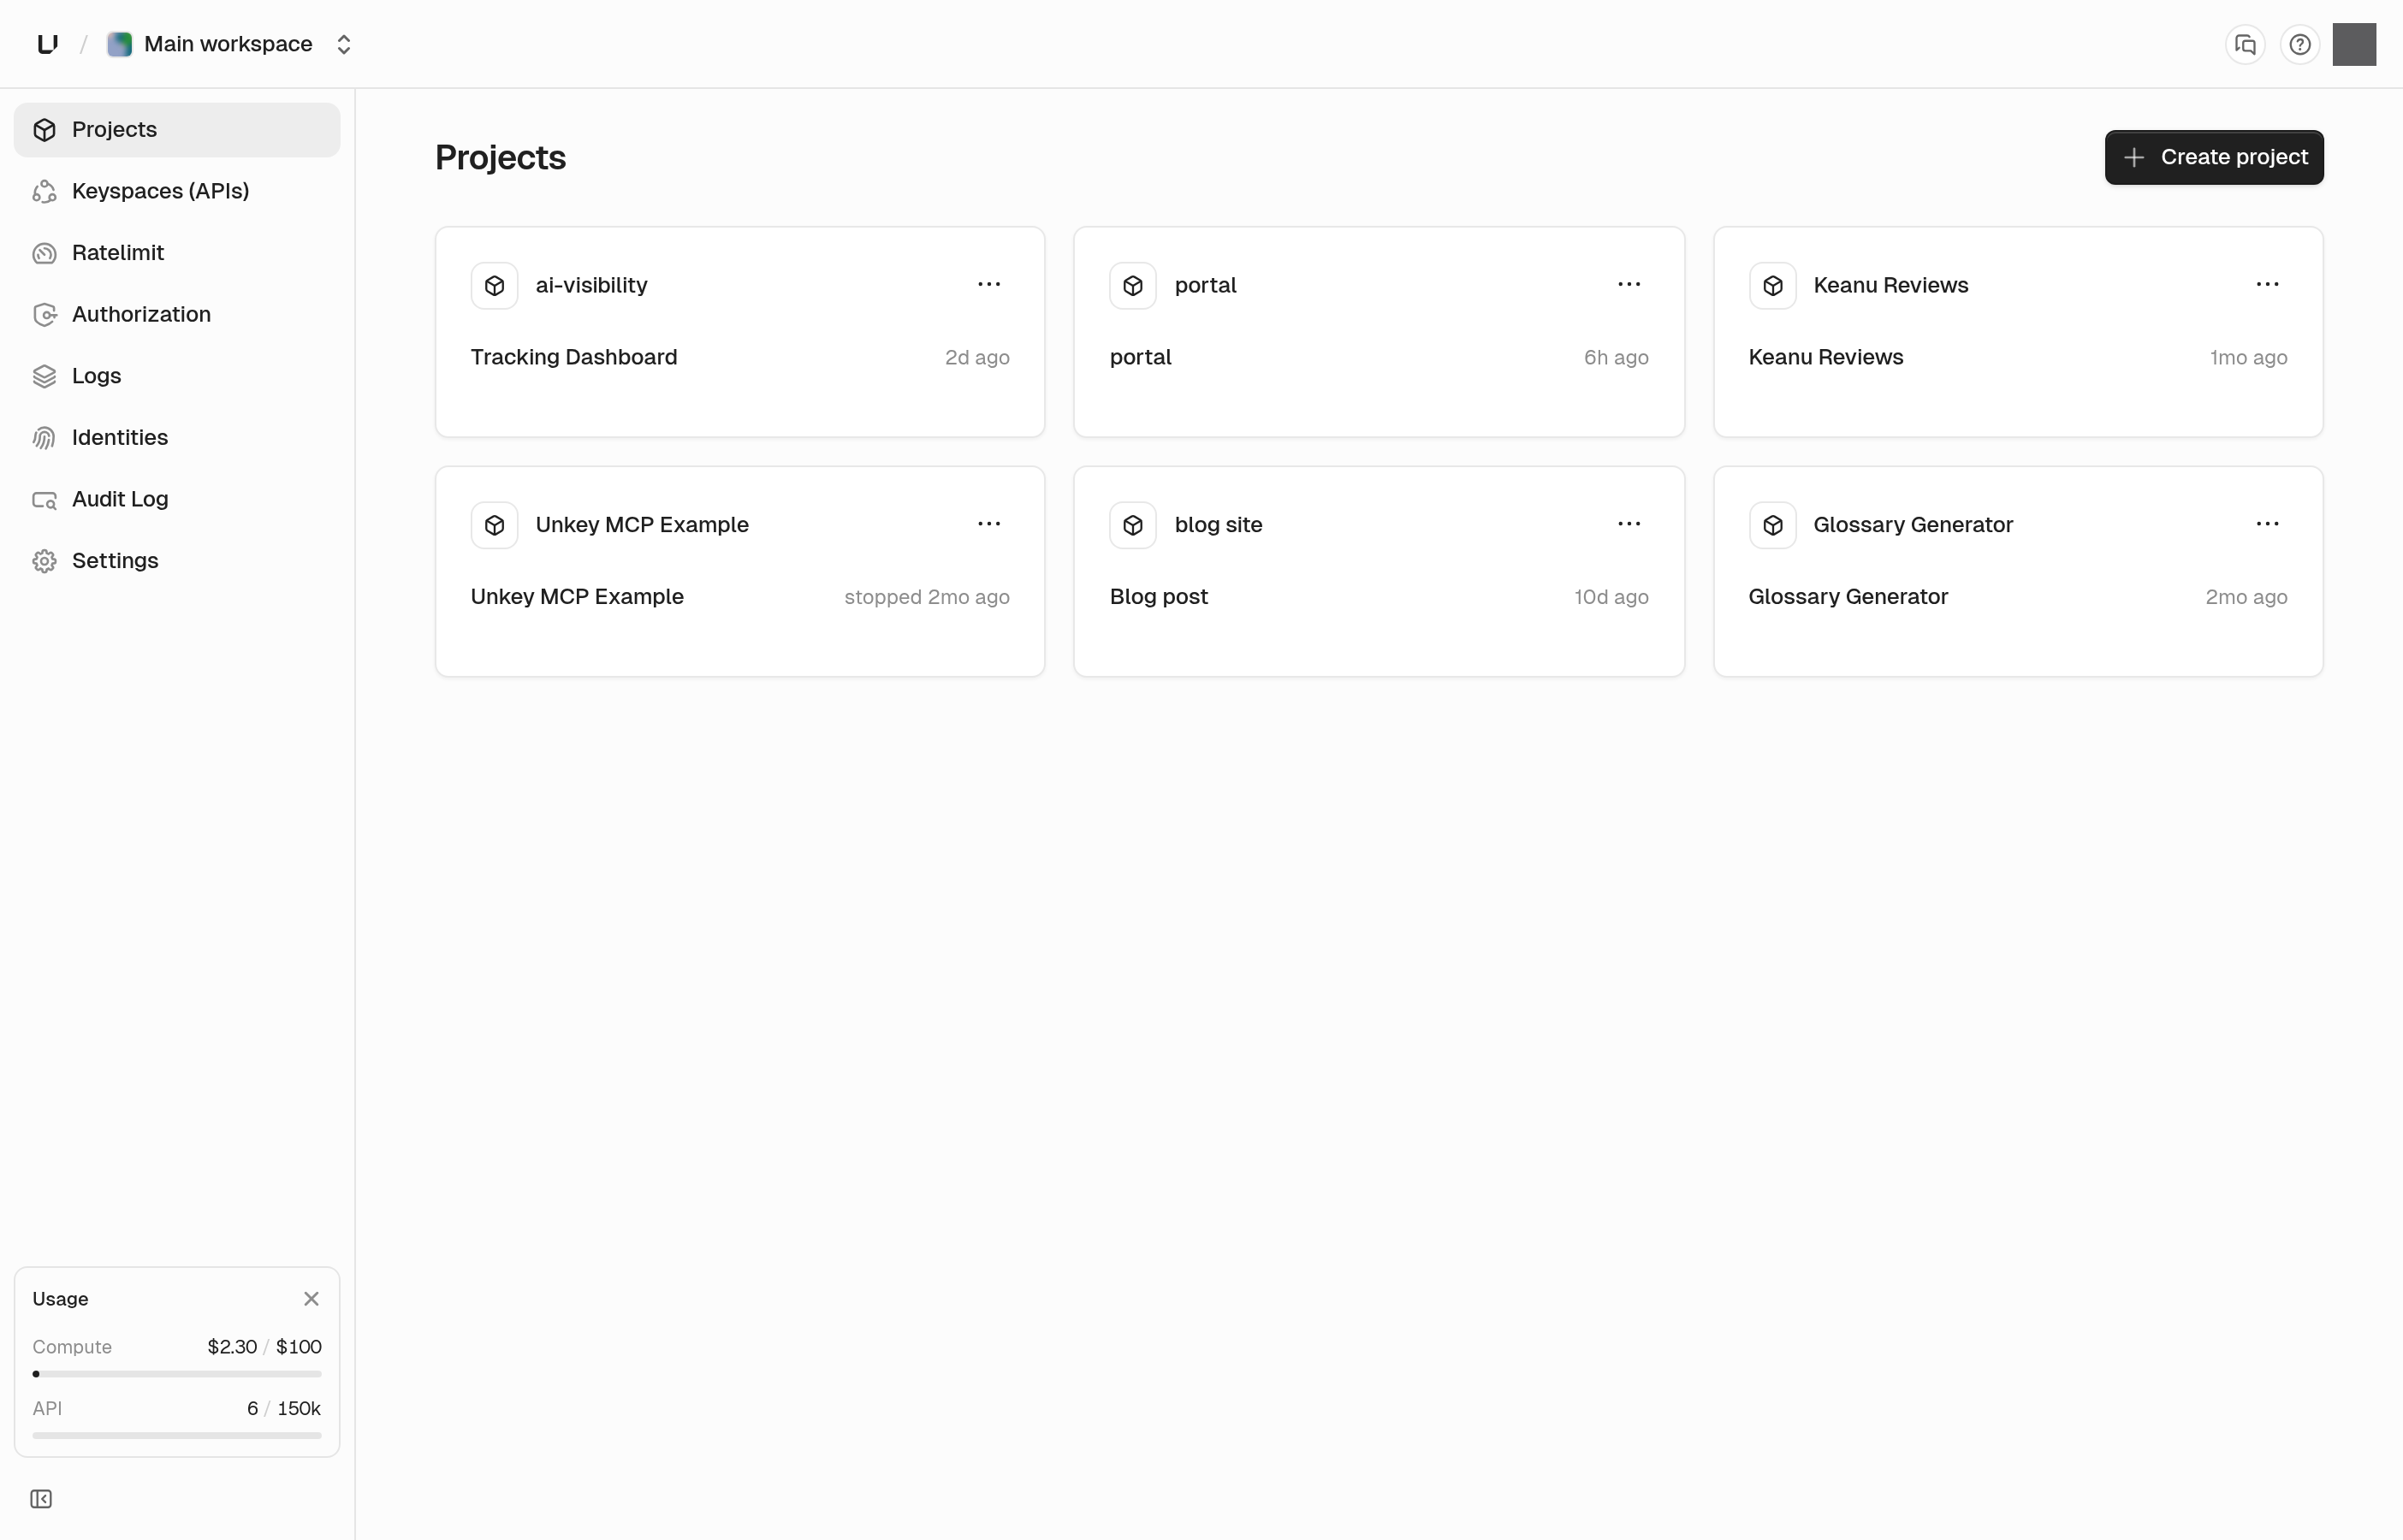
Navigation moved around a little. App Logs and Requests live in the sidebar. On a deployment, logs and requests sit behind a more menu with rollback, promote, wake, and stop.
Key rotation and keyspace filtering on verify
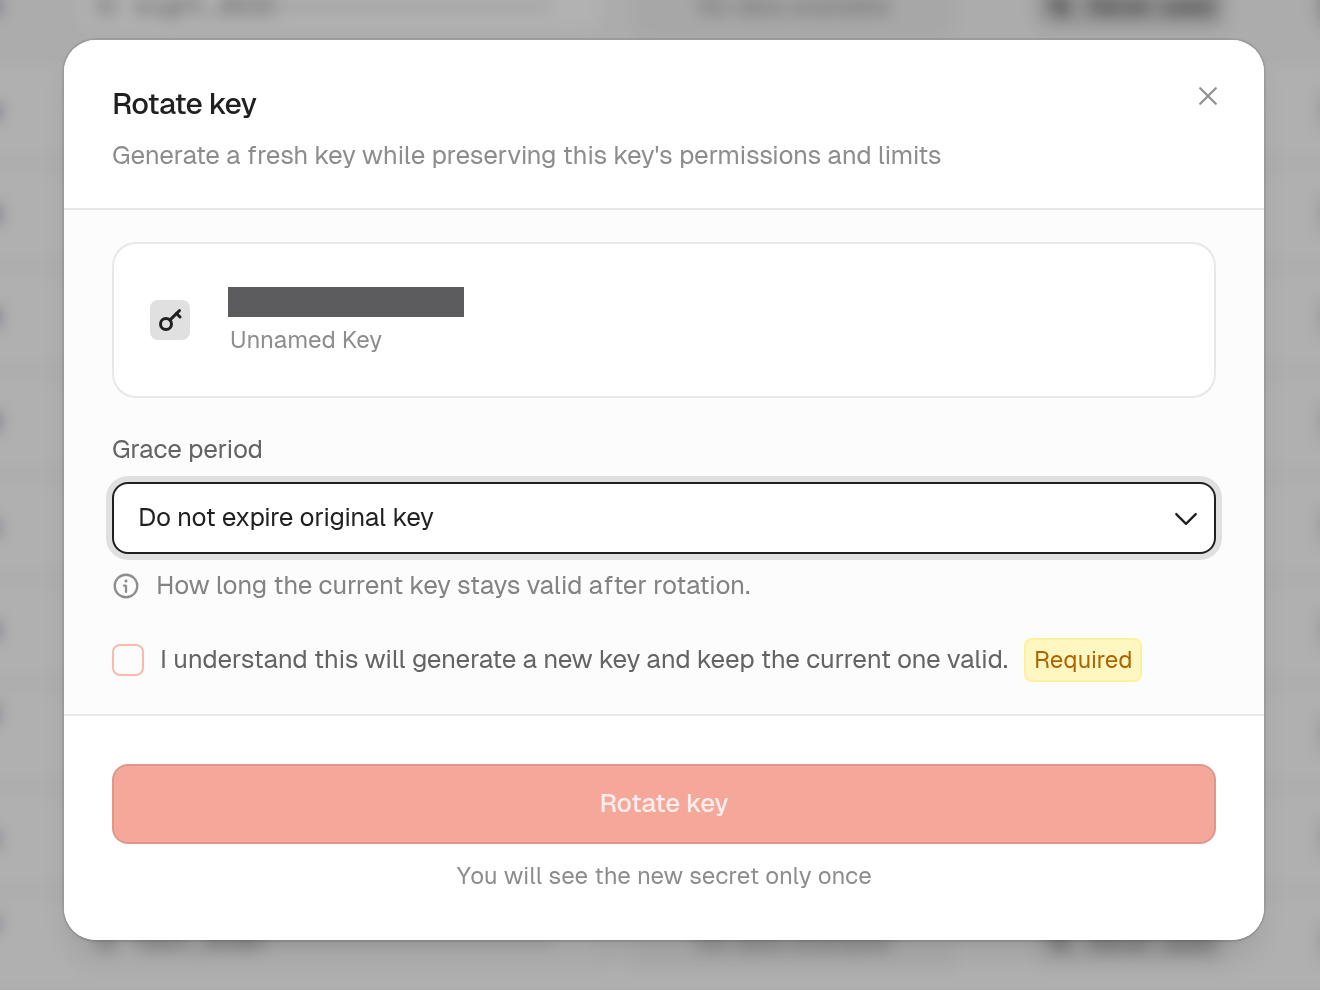
keys.rerollKey now accepts expiration: null. The original key keeps its current expiry. You can still set a grace period if you want the old secret to stop working. The rotate dialog in the dashboard gives you the same choice.
keys.verifyKey now takes an optional keyspaces list. If the key isn't in one of those keyspaces, the result is not found. Use it when one root key can verify several keyspaces but a given endpoint should only accept some of them. When the key is found, the result includes its keyspace id.
See rerolling keys and verifying keys.
Root key creation and project-scoped permissions
rootKeys.createKey lets an admin or another root key create a root key. The new key can't have more permissions than the caller. If the caller has an expiration, the new key needs one too, and it can't outlive the caller.
Root keys and roles can use a project-scoped permission catalog, so access can stop at one project instead of the whole workspace. Project-scoped root keys can call more of the API: projects, apps, deployments, APIs, GitHub installs, analytics queries, and portals. The dashboard shows the full permission set when you create or edit a root key. You can set permissions on a role, and attach them when you create one.
See root key permissions.
Key tables show the prefix and the last four characters. The root keys table shows when each key was last used, with a small usage chart. If a key was used in the last seven days, we ask you to confirm before deleting it.
Client IP firewall, credit costs, and compound rate limits
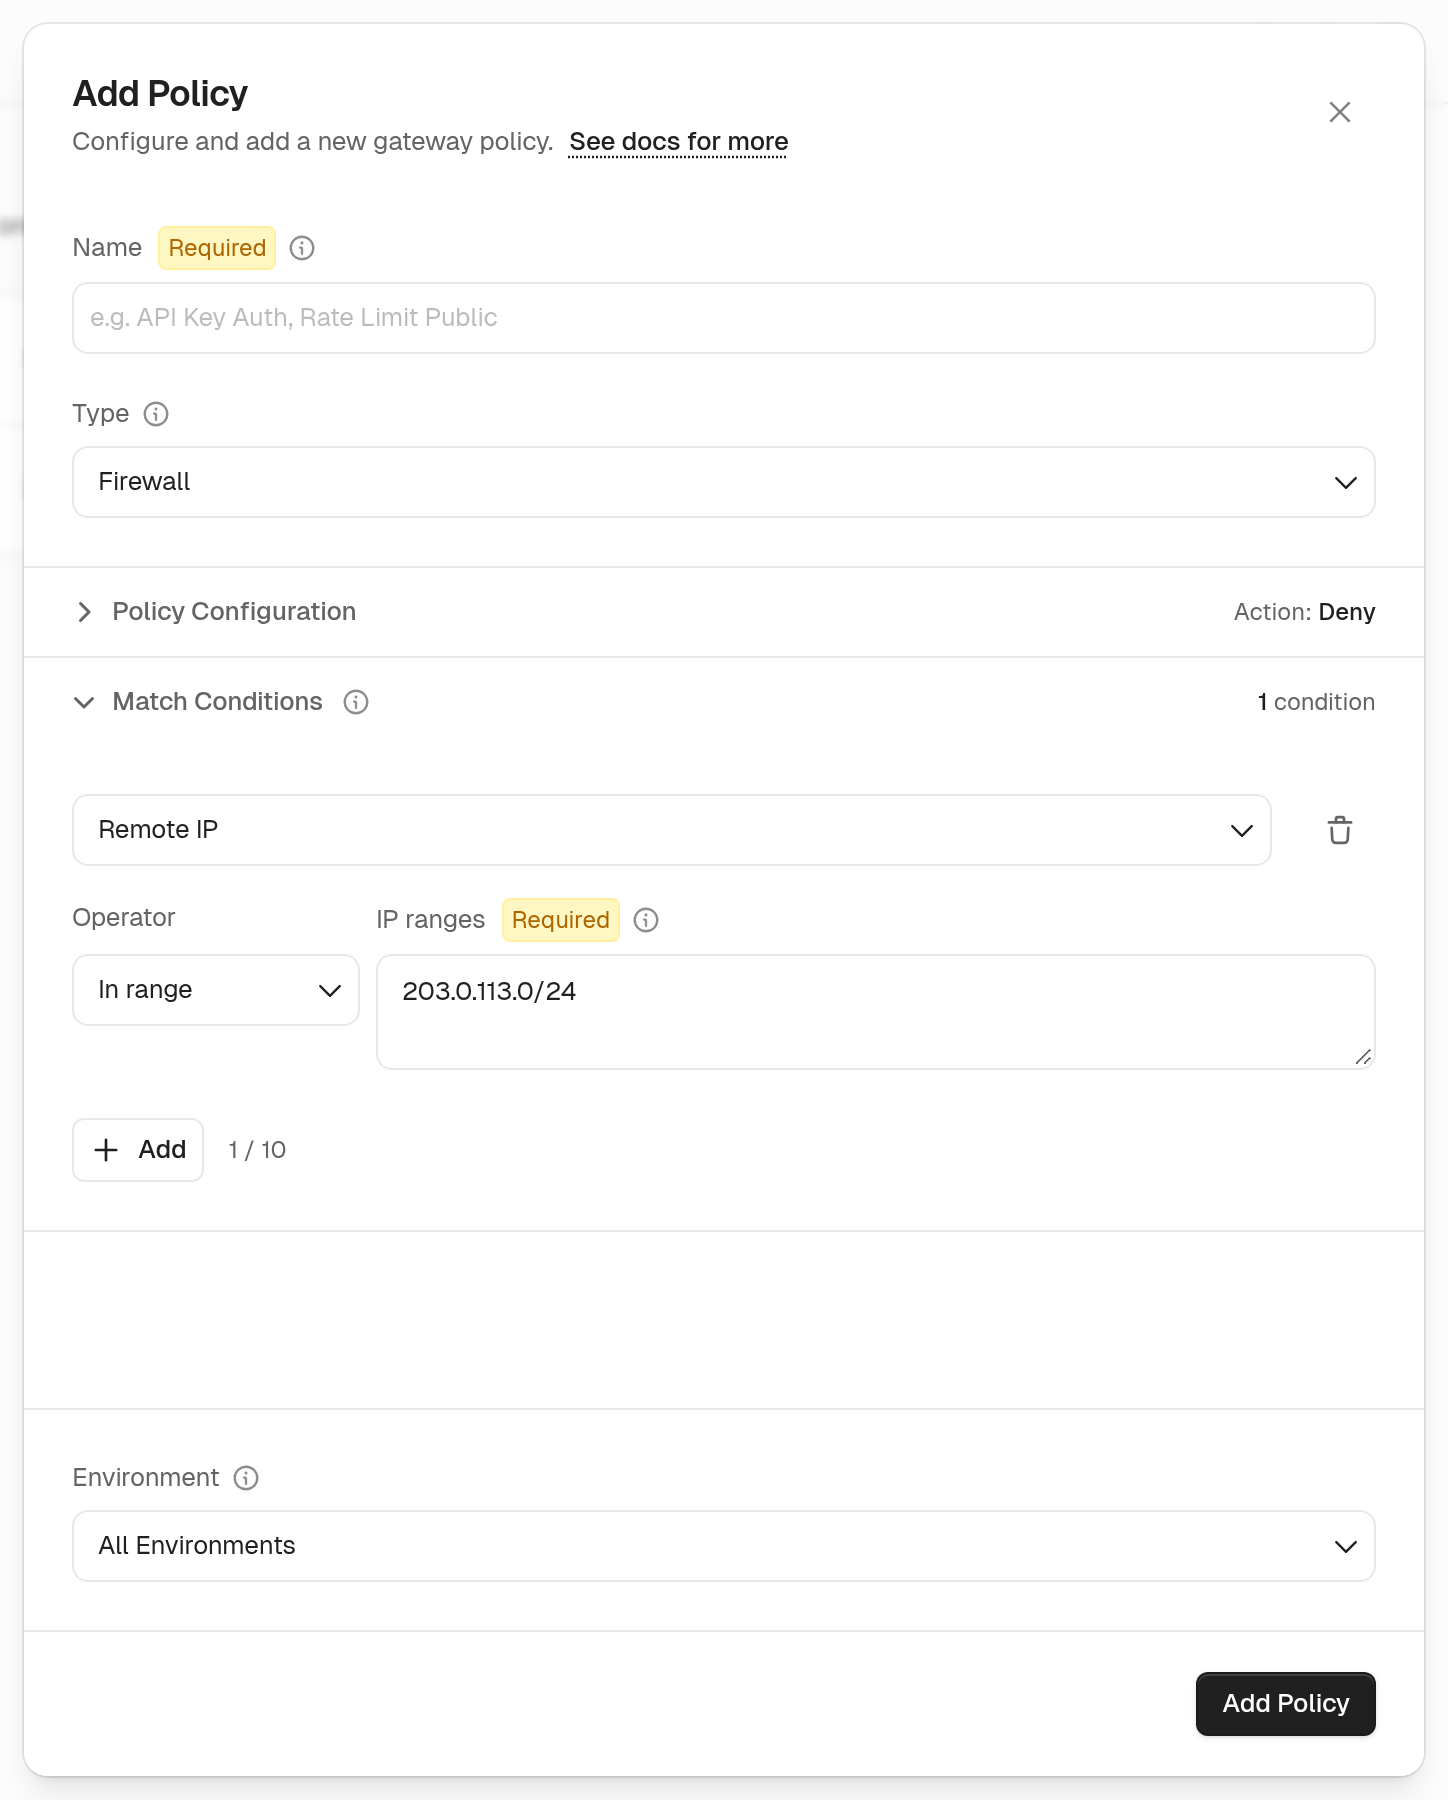
Gateway policies can match the client IP against in or notIn lists of addresses and CIDR ranges. Use a firewall policy to block a range, or to allow only the ranges you list. The gateway reads the connection address, so a caller can't swap in a different one.
A key auth policy can override credit cost, so an expensive route can cost more than a cheap one without a second key. A ratelimit policy can use a compound identifier, so you can limit "this user on this route" without a second limiter. Read and write on gateway policies are separate permissions. You can grant list access without granting updates.
See firewall policies and gateway policies.
Verification analytics in the portal
A portal session can request analytics:read along with keys:read. The keys page then shows that user's own verification counts over time, broken down by outcome. The session only sees its own keyspaces.
New portal ids start with prt_, and exchange codes start with pec_. Unknown links show a not-found page. We removed preview mode, so creating a session no longer accepts it and the portal no longer shows a preview banner.
A single plans screen for Compute and API
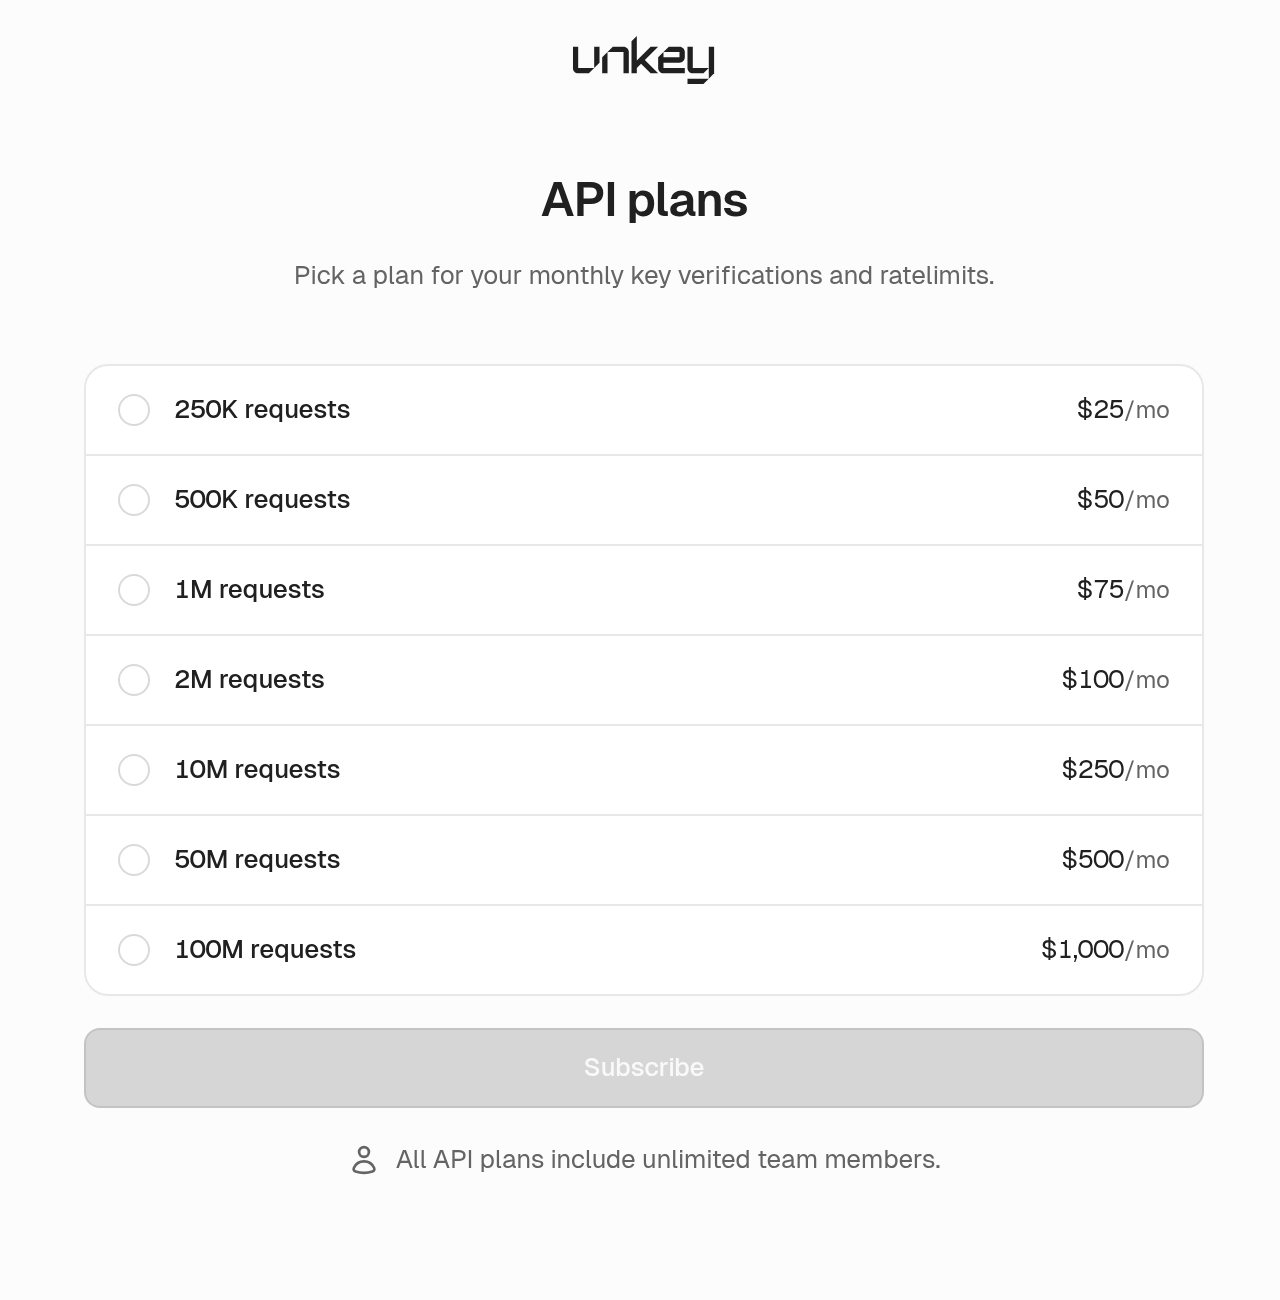
Upgrades and paywalls now open one plans screen for both Compute and API, and you get a confirmation after you buy. Your first API plan takes a single checkout.
More resources in the CLI and API
unkey api can create, get, update, and delete the resources you were clicking through: projects, apps, deployments, gateway policies, analytics, domains, GitHub installs, role permissions, and portals. It can list domains without an environment filter.
GitHub works the same way. You can install the GitHub app and connect repos through the API. One GitHub account or organization can connect to more than one workspace, and each workspace authorizes the connection separately.
See the CLI.
Smaller updates
Account settings live on their own route, and team and account settings match the rest of the dashboard. API names are no longer forced into slugs. Role names you create in the dashboard are valid in OpenAPI. The top bar is more compact, and tips with buttons or links open as a card you can read and click.
The smaller fixes are in the September 4 changelog and the September 30 changelog.
Ship APIs, not infrastructure.