> ## Documentation Index
> Fetch the complete documentation index at: https://unkey.com/docs/llms.txt
> Use this file to discover all available pages before exploring further.
> ## Agent Instructions
> Unkey is two separate products. Compute builds, deploys, and runs apps behind a gateway. API Management issues API keys, enforces rate limits, manages identities and permissions, and reports usage. Say which product a page belongs to; a reader can use either without the other.
> Every Unkey API endpoint is an HTTP POST to https://api.unkey.com/v2/{service}.{procedure} with a root key in the Authorization: Bearer header. Root keys are workspace scoped.
> Error codes have the form err:{system}:{category}:{specific} and each has a page at /errors/{system}/{category}/{specific}.
> The word environment means production or preview in Compute. Rate limiting has four meanings on this site; the glossary lists them.
# Runtime logs
> Read and filter what your instances write to stdout and stderr.
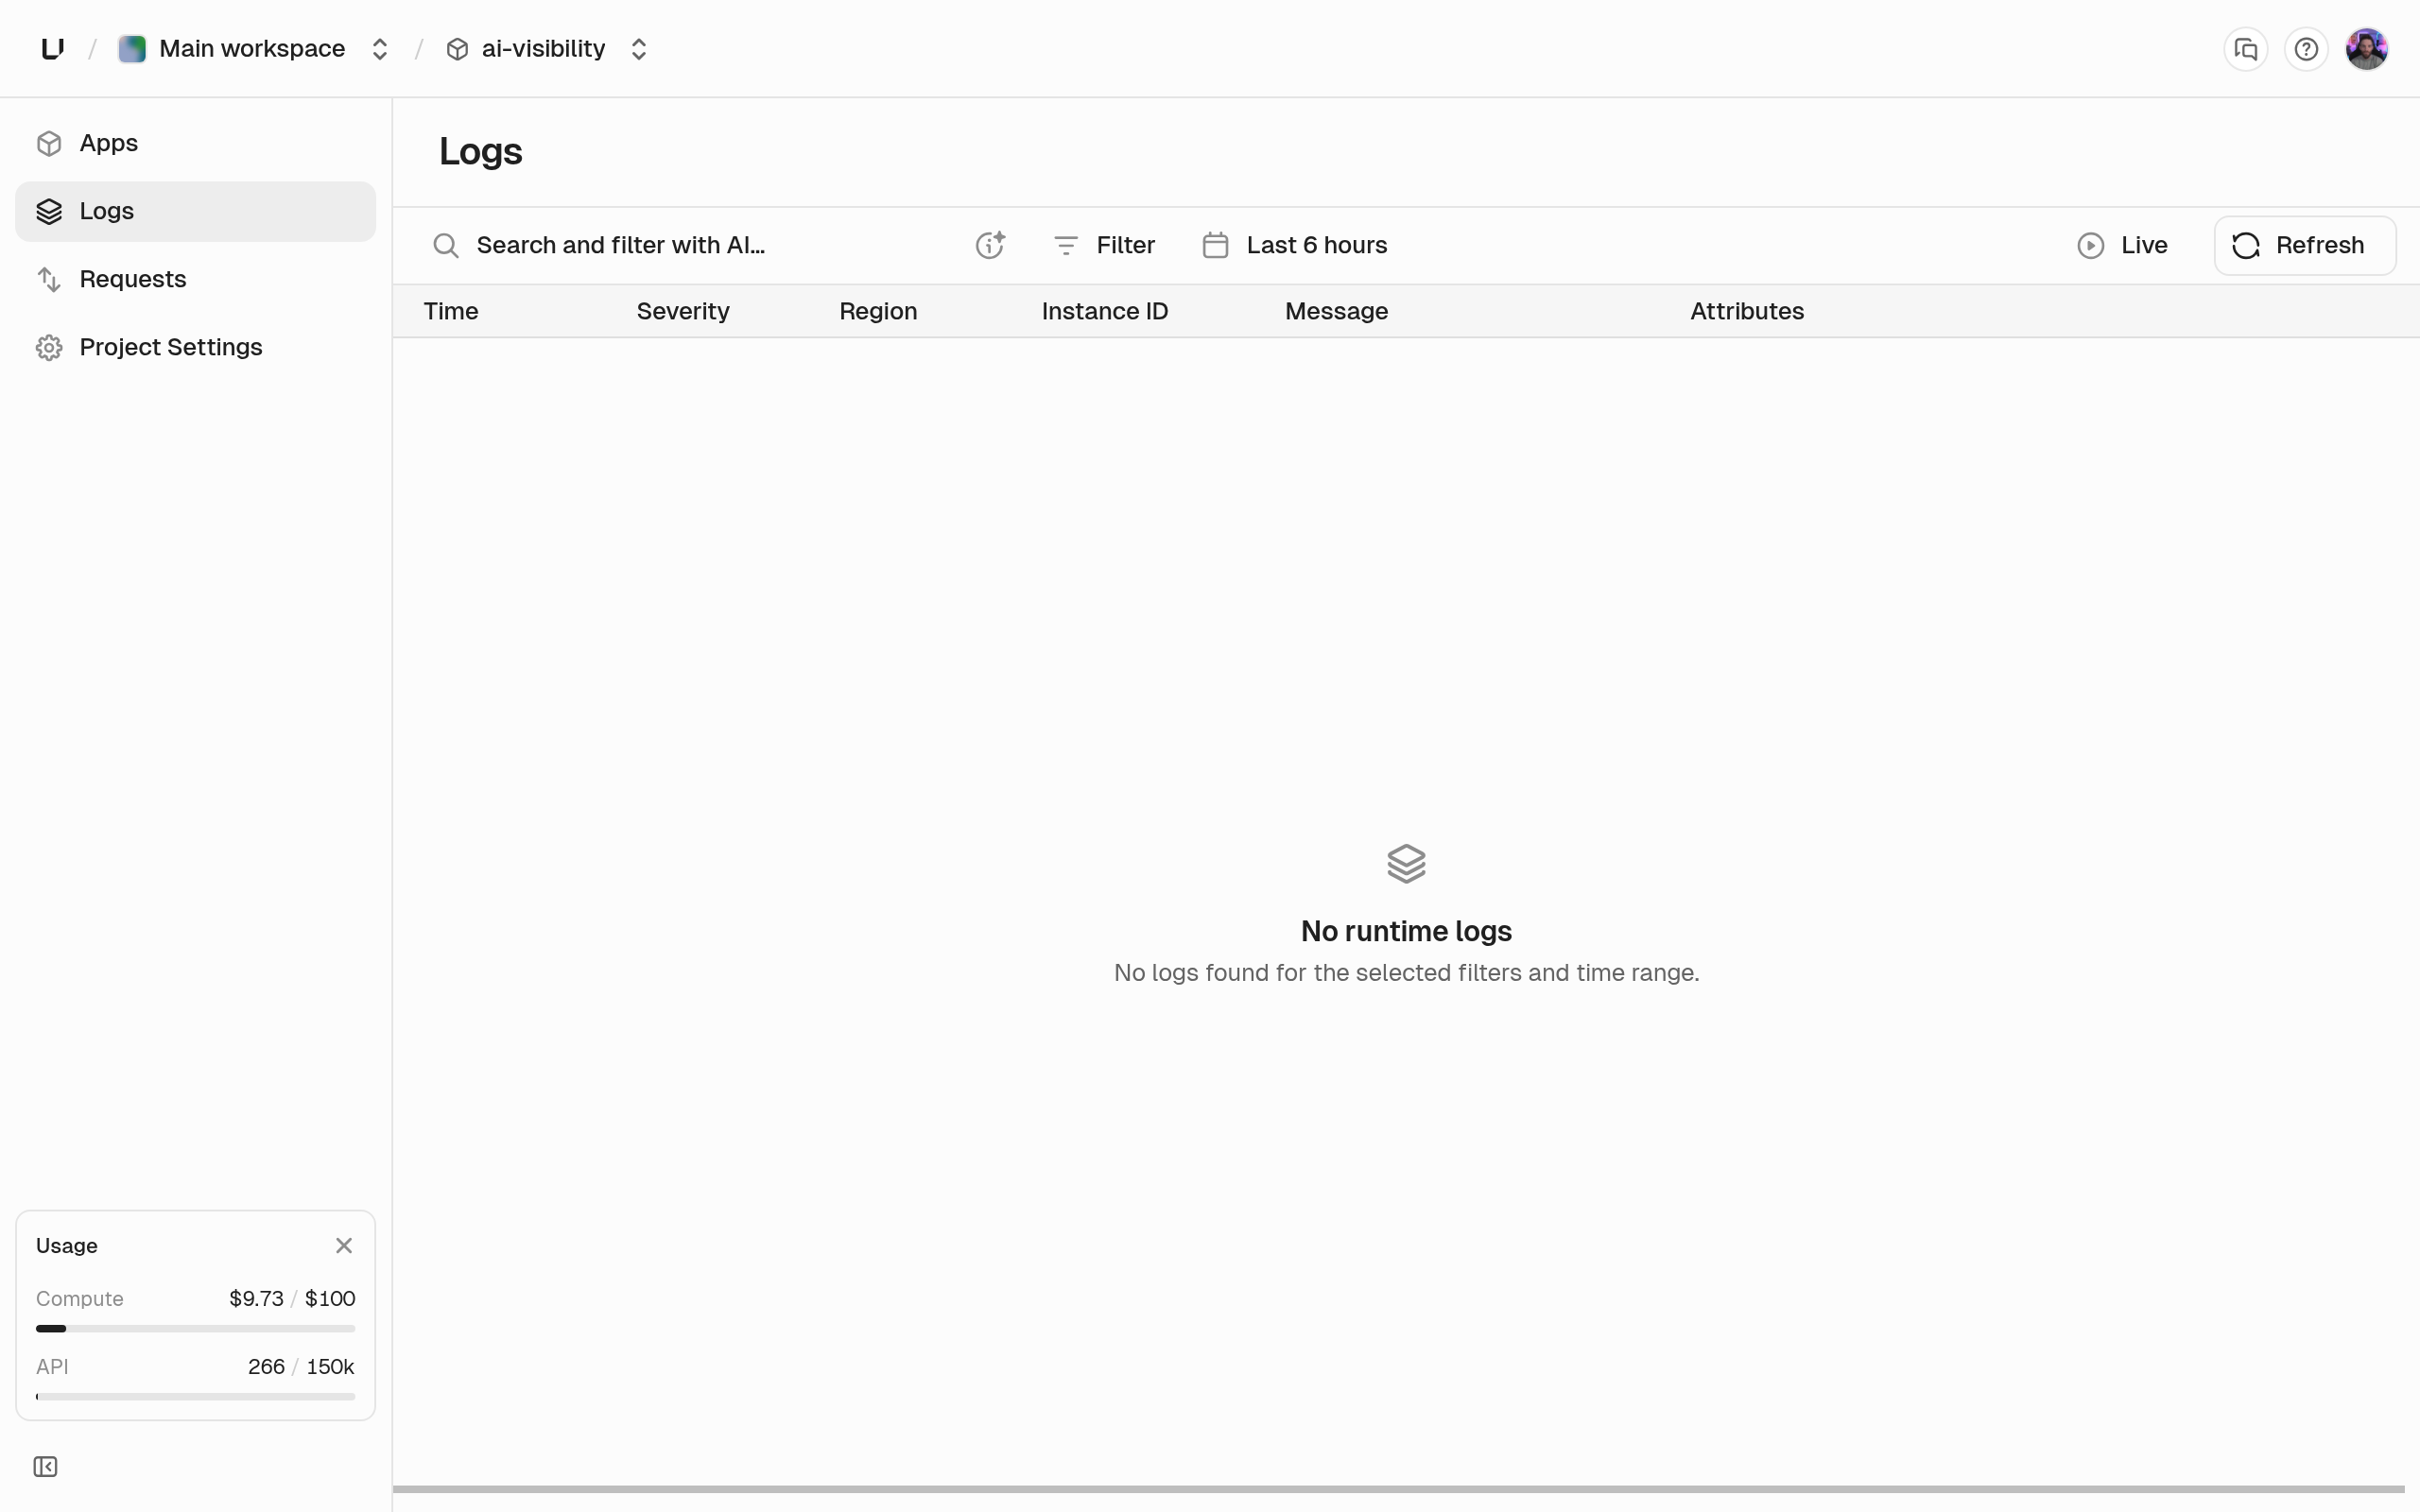
Everything your instances write to stdout or stderr shows up as runtime logs, with nothing to install or configure. Print a line and it appears under **Logs** in the project a few seconds later, tagged with the app, environment, deployment, region, and instance that wrote it.
## Write logs you can filter
Print one JSON object per line, with `level` and `message` (or `msg`), and put the values you'll search for in their own fields:
```json theme={"system"}
{"level":"error","message":"charge failed","order_id":"ord_1234","customer":{"id":"cus_98","plan":"pro"},"attempt":3}
```
That entry has severity `error`, message `charge failed`, and attributes `order_id`, `customer.id`, `customer.plan`, and `attempt`, which you can all filter on.
## How lines are read
Color codes are removed first.
* **JSON object:** the message is `msg` or `message` (or the whole line), the severity is `level` or `severity` (default `info`), and every other key becomes an attribute, including nested ones.
* **`key=value` (logfmt):** handled like JSON, but only if the line has `level`, `severity`, `msg`, or `message`.
* **Anything else:** plain text. The whole line is the message, and we guess the severity. Panics, tracebacks, exception names, and words like `error`, `fatal`, `failed to`, `crashed`, or `oom` mean error. `warn` or `warning` mean warning, and `debug` or `trace` mean debug. Everything else is info. If severity matters, use JSON.
## Filter the logs
 | Filter | Operators | Notes |
| - | - | - |
| Severity | is | `ERROR`, `WARN`, `INFO`, `DEBUG` |
| Message | contains | Case-insensitive substring, at least 3 characters |
| Attributes | is, contains | Written as `path=value`, for example `customer.plan=pro`. The value must be at least 3 characters. |
| App, environment, deployment, region, instance | is | Narrow from the project to one source |
| Time | since, or start and end | Relative or absolute range |
Each entry shows its severity, time, message, attributes, and the instance and region that wrote it.
## Retention and access
Runtime logs are kept for 90 days, and the dashboard shows all of them. The [analytics API](/docs/compute/observe/analytics-api) can only reach back as far as your plan's log query range: 3 days on Starter, 7 on Pro, and 14 on Business. A query that reaches further fails with [`err:user:bad_request:query_range_exceeds_retention`](/docs/errors/user/bad_request/query_range_exceeds_retention). See [Compute limits](/docs/compute/configure/limits).
To query logs with SQL, use the `runtime_logs_v1` table. See [Query gateway requests and runtime logs](/docs/compute/observe/analytics-api).
| Filter | Operators | Notes |
| - | - | - |
| Severity | is | `ERROR`, `WARN`, `INFO`, `DEBUG` |
| Message | contains | Case-insensitive substring, at least 3 characters |
| Attributes | is, contains | Written as `path=value`, for example `customer.plan=pro`. The value must be at least 3 characters. |
| App, environment, deployment, region, instance | is | Narrow from the project to one source |
| Time | since, or start and end | Relative or absolute range |
Each entry shows its severity, time, message, attributes, and the instance and region that wrote it.
## Retention and access
Runtime logs are kept for 90 days, and the dashboard shows all of them. The [analytics API](/docs/compute/observe/analytics-api) can only reach back as far as your plan's log query range: 3 days on Starter, 7 on Pro, and 14 on Business. A query that reaches further fails with [`err:user:bad_request:query_range_exceeds_retention`](/docs/errors/user/bad_request/query_range_exceeds_retention). See [Compute limits](/docs/compute/configure/limits).
To query logs with SQL, use the `runtime_logs_v1` table. See [Query gateway requests and runtime logs](/docs/compute/observe/analytics-api).