> ## Documentation Index
> Fetch the complete documentation index at: https://unkey.com/docs/llms.txt
> Use this file to discover all available pages before exploring further.
> ## Agent Instructions
> Unkey is two separate products. Compute builds, deploys, and runs apps behind a gateway. API Management issues API keys, enforces rate limits, manages identities and permissions, and reports usage. Say which product a page belongs to; a reader can use either without the other.
> Every Unkey API endpoint is an HTTP POST to https://api.unkey.com/v2/{service}.{procedure} with a root key in the Authorization: Bearer header. Root keys are workspace scoped.
> Error codes have the form err:{system}:{category}:{specific} and each has a page at /errors/{system}/{category}/{specific}.
> The word environment means production or preview in Compute. Rate limiting has four meanings on this site; the glossary lists them.
# Request logs
> Inspect every request the gateway proxied and what a logging policy adds to it.
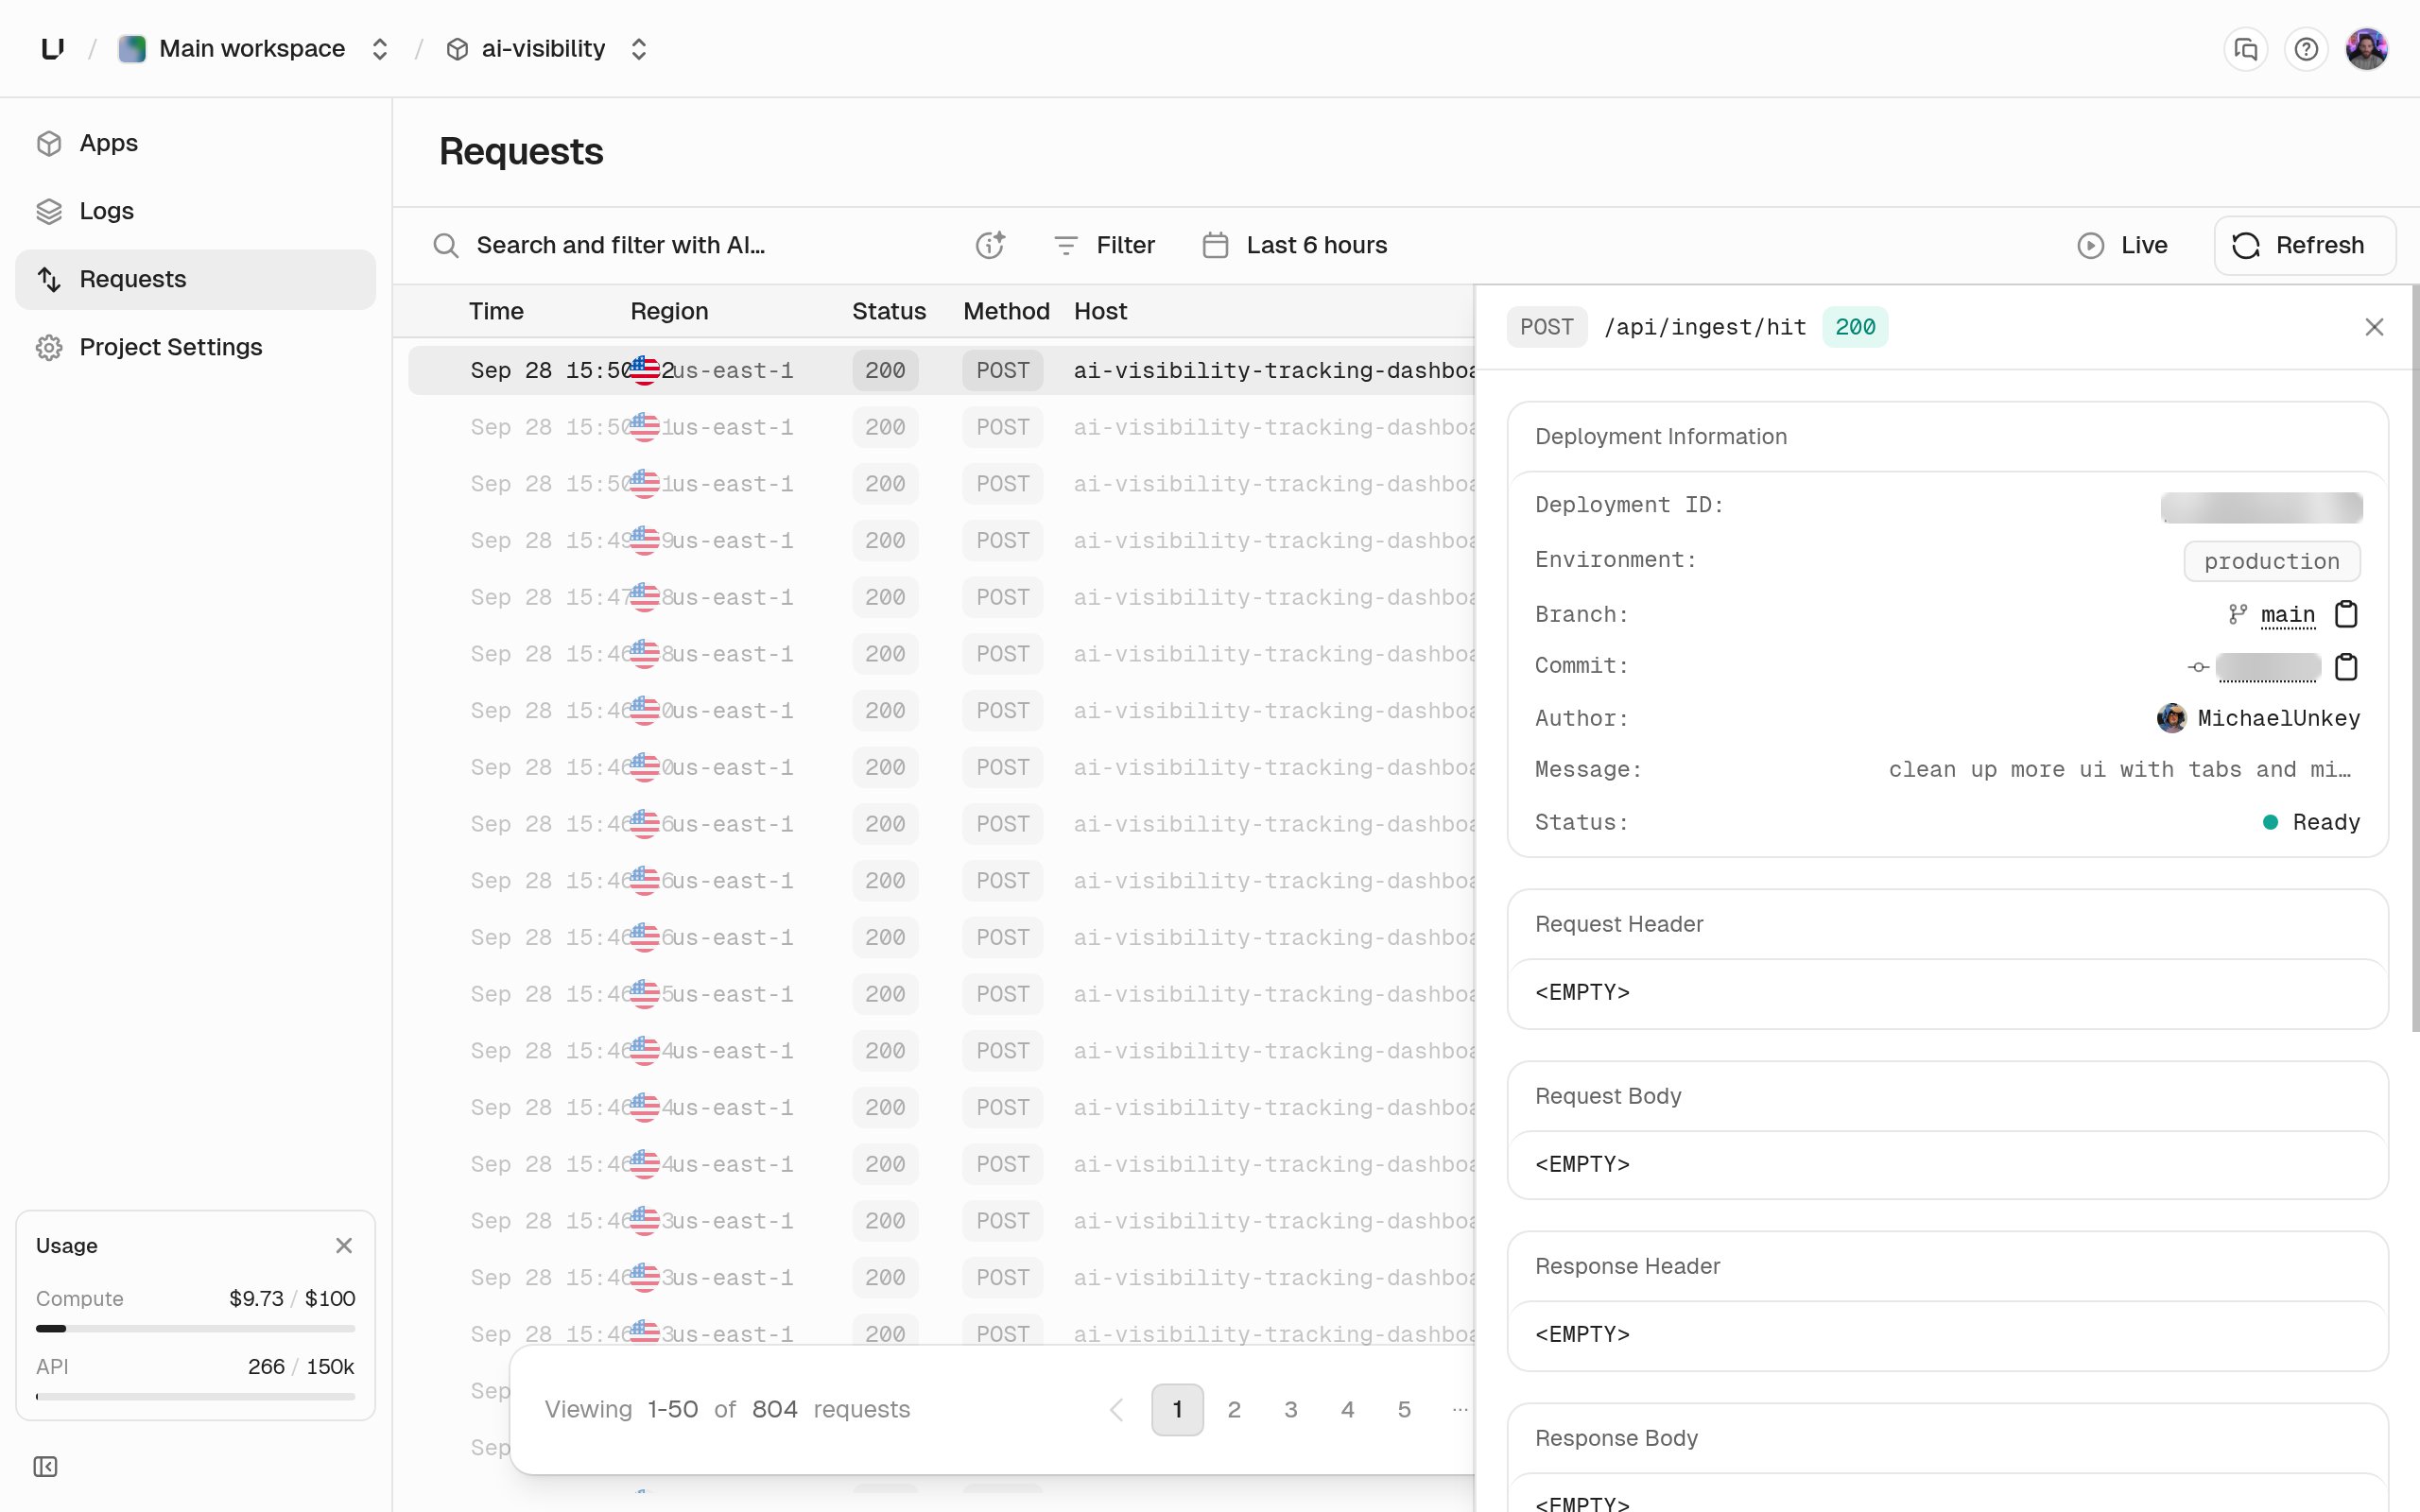
The request log shows every request that reached your app: method, host, path, status, how long it took, and which environment, deployment, instance, and region served it. Headers, bodies, and query data are only saved when a logging policy asks for them, because they often contain secrets.
Open a project and click **Requests** to see it.
 ## Why a request is missing
Only requests that reached your app are logged. These aren't:
* Requests rejected by a [gateway policy](/docs/compute/gateway/policies). The caller got a `401`, `403`, `429`, or `400`, and your app never saw it.
* Requests the gateway couldn't route, such as an unknown hostname or a deployment with no running instances.
Errors after the request was forwarded, such as a timeout, are logged with the status the caller got. A request served in another region is logged there.
## What each row has
| Field | Meaning |
| - | - |
| `request_id` | Also sent to the client and to your app as `X-Unkey-Request-Id` |
| `time` | When the gateway received the request |
| `method`, `host`, `path` | The request line |
| `response_status` | The status the client received |
| `total_latency` | Milliseconds from receipt to the end of the response |
| `instance_latency` | Milliseconds your app took, from when the gateway forwarded the request to the end of your response |
| `gateway_latency` | `total_latency` minus `instance_latency`: time spent in the gateway, including policies |
| `region` | The region of the gateway that served it |
| `project_id`, `app_id`, `environment_id`, `deployment_id`, `instance_id` | Where it went |
## What a logging policy adds
A [logging policy](/docs/compute/gateway/logging) can also save request headers (with the user agent and client IP), response headers, request and response bodies (up to 1 MiB each), and the query string. API keys are always redacted, so a saved request never contains a usable key.
## Filter the log
Filters narrow the list and the charts above it.
| Filter | Operators |
| - | - |
| Status | is |
| Method | is |
| Path | is, starts with, contains (at least 3 characters for the last two) |
| Host | is |
| Request ID | is |
| App, environment, deployment, region | is |
| Time | since, or start and end |
Click a row to see all of it, including any saved headers, bodies, and query data.
## Retention and access
Rows are kept for 7 days, and the dashboard shows all of them. The [analytics API](/docs/compute/observe/analytics-api) can reach back 3 days on Starter and 7 on Pro and Business, because Business's 14-day query range is longer than the rows are kept. A query that reaches further fails with [`err:user:bad_request:query_range_exceeds_retention`](/docs/errors/user/bad_request/query_range_exceeds_retention). See [Compute limits](/docs/compute/configure/limits).
Request counts and latency charts on [Metrics](/docs/compute/observe/metrics) go back further. To query rows with SQL, use the `gateway_requests_v1` table. See [Query gateway requests and runtime logs](/docs/compute/observe/analytics-api).
## Why a request is missing
Only requests that reached your app are logged. These aren't:
* Requests rejected by a [gateway policy](/docs/compute/gateway/policies). The caller got a `401`, `403`, `429`, or `400`, and your app never saw it.
* Requests the gateway couldn't route, such as an unknown hostname or a deployment with no running instances.
Errors after the request was forwarded, such as a timeout, are logged with the status the caller got. A request served in another region is logged there.
## What each row has
| Field | Meaning |
| - | - |
| `request_id` | Also sent to the client and to your app as `X-Unkey-Request-Id` |
| `time` | When the gateway received the request |
| `method`, `host`, `path` | The request line |
| `response_status` | The status the client received |
| `total_latency` | Milliseconds from receipt to the end of the response |
| `instance_latency` | Milliseconds your app took, from when the gateway forwarded the request to the end of your response |
| `gateway_latency` | `total_latency` minus `instance_latency`: time spent in the gateway, including policies |
| `region` | The region of the gateway that served it |
| `project_id`, `app_id`, `environment_id`, `deployment_id`, `instance_id` | Where it went |
## What a logging policy adds
A [logging policy](/docs/compute/gateway/logging) can also save request headers (with the user agent and client IP), response headers, request and response bodies (up to 1 MiB each), and the query string. API keys are always redacted, so a saved request never contains a usable key.
## Filter the log
Filters narrow the list and the charts above it.
| Filter | Operators |
| - | - |
| Status | is |
| Method | is |
| Path | is, starts with, contains (at least 3 characters for the last two) |
| Host | is |
| Request ID | is |
| App, environment, deployment, region | is |
| Time | since, or start and end |
Click a row to see all of it, including any saved headers, bodies, and query data.
## Retention and access
Rows are kept for 7 days, and the dashboard shows all of them. The [analytics API](/docs/compute/observe/analytics-api) can reach back 3 days on Starter and 7 on Pro and Business, because Business's 14-day query range is longer than the rows are kept. A query that reaches further fails with [`err:user:bad_request:query_range_exceeds_retention`](/docs/errors/user/bad_request/query_range_exceeds_retention). See [Compute limits](/docs/compute/configure/limits).
Request counts and latency charts on [Metrics](/docs/compute/observe/metrics) go back further. To query rows with SQL, use the `gateway_requests_v1` table. See [Query gateway requests and runtime logs](/docs/compute/observe/analytics-api).